


 19 February 2015
2015- n° 35In January 2015, prices of frequently purchased goods declined again by 0.1% in hyper
and supermarkets Price Index in large and predominantly-food stores - January 2015
19 February 2015
2015- n° 35In January 2015, prices of frequently purchased goods declined again by 0.1% in hyper
and supermarkets Price Index in large and predominantly-food stores - January 2015
In January 2015, prices of frequently purchased goods declined by 0.1% in hyper and supermarkets, as the same pace as during the last three months.
In January 2015, prices of frequently purchased goods declined by 0.1% in hyper and supermarkets, as the same pace as during the last three months.
In large and predominantly food stores (plus neighborhood stores), prices of frequently purchased goods have also been down 0.1% month-on-month since October 2014.
Excluding hyper and supermarkets, prices of frequently purchased goods diminished by 0.1% in January 2015 after a steadiness in December 2014 and an increase by 0.3% in November.
Year-on-year, prices of frequently purchased goods decreased by 1.1% in hyper and supermarkets
Year-on-year, prices of frequently purchased goods in hyper and supermarkets decreased by 1.1% in January 2015, just slightly more than in the two previous months (-1.0%). In January 2014, they had declined by 0.1% year-on-year.
In large and predominantly food stores plus neighborhood stores, the magnitude of the fall in prices of frequently purchased goods was similar (-1.1% after -1.0% in December). In January 2014, they were stable year-on-year.
Considering all the kinds of stores, the decrease in the prices of frequently purchased goods was slightly less pronounced (-0.7% year-on-year). In January 2014, they had risen by 0.3% year-on-year.
graphiqueGraphique1English – Frequently purchased goods price indexes year-on-year change %
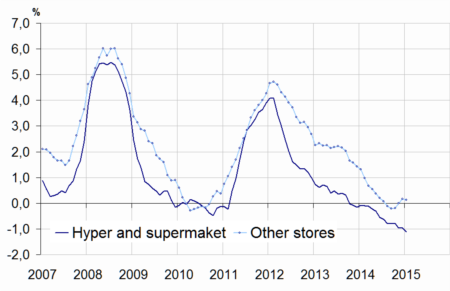
- Source : INSEE - Consumer Price Indexes
graphiqueGraphique2English – Frequently purchased goods price indexes
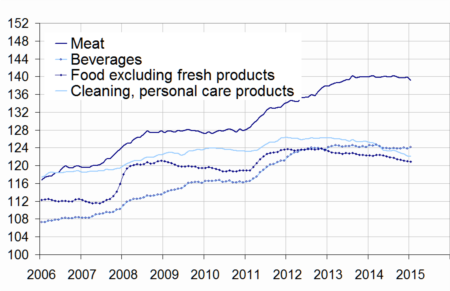
- Source : INSEE - Consumer Price Indexes
tableauTableau1English – Prices of frequently purchased goods
| Index | Changes (%) compared to | ||
|---|---|---|---|
| Jan. 2015 | last month (m-o-m) | 12 months before (y-o-y) | |
| Hyper-and-Supermarkets (A) | 125.67 | -0.1 | -1.1 |
| Large and predominantly food stores (A + neighborhood stores) | 126.78 | -0.1 | -1.1 |
| Other stores | 135.74 | -0.1 | 0.1 |
| All stores | 128.69 | -0.1 | -0.7 |
- Source : INSEE - Consumer Price Indexes
tableauTableau2English – Prices of frequently purchased goods detailed by main items
| Index | Changes (%) compared to | ||
|---|---|---|---|
| January 2015 | last month (m-o-m) | 12 months before (y-o-y) | |
| Food and beverages (excluding fresh foodstuffs) | 126.54 | -0.1 | -0.8 |
| - Meat | 139.18 | -0.5 | -0.6 |
| - Beverages | 124.18 | 0.3 | -0.4 |
| - Other food products | 120.93 | -0.1 | -1.1 |
| Clearing and personal care products | 122.08 | 0.0 | -2.5 |
| Total : Hyper-and-Supermarkets | 125.67 | -0.1 | -1.1 |
- Source : INSEE - Consumer Price Indexes
Food prices declined in hyper and supermarkets in January 2015
Excluding fresh products, prices of food declined somewhat in hyper and supermarkets (-0.1%) in January 2015 after they had held steady in December 2014. Year-on-year, they went down by 0.8% (after -0.6% in December 2014). In January 2014, they were slightly up (+0.1%) year-on-year.
In January 2015, meat prices decreased by 0.5% in hyper and supermarkets after staying broadly stable during the three previous months. Year-on-year, they were down 0.6%. In January 2014, they had risen by 1.6% year-on-year.
In hyper and supermarkets, beverage prices recovered (+0.3% in January 2015, after -0.1% in December 2014). However, they decreased by 0.4% year-on-year (after -0.2% year-on-year in December 2014). In January 2014, they had grown by 0.4% year-on-year.
Excluding fresh foodstuffs, prices of other food products declined slightly again in hyper and supermarkets (-0.1% as in December 2014). Year-on-year, they fell by 1.1%, after -1.0% in December 2014. In January 2014, they were down 0.9% year-on-year.
Prices of cleaning and personal care products were stable in January
In January 2015, prices of cleaning and personal care products held steady in hyper and supermarkets, after four months of decline. Year-on-year, they dropped by 2.5% (-2.7% in December 2014). In January 2014, they had declined by 0.8% year-on-year.
Pour en savoir plus
