


 14 August 2014
2014- n° 188In July 2014, oil prices decreased Prices of oil and raw material imports - July 2014
14 August 2014
2014- n° 188In July 2014, oil prices decreased Prices of oil and raw material imports - July 2014
In July, the price of crude oil in euro terms dropped (-3.7%) and stood at €79.2 on average per barrel of Brent. Prices of imported commodities except energy in euros climbed (+2.1%), on account of the increase in industrial raw materials prices (+4.8%).
In July, the price of crude oil in euro terms dropped (-3.7%) and stood at €79.2 on average per barrel of Brent. Prices of imported commodities except energy in euros climbed (+2.1%), on account of the increase in industrial raw materials prices (+4.8%).
Downturn in oil prices
In July, the price of crude oil from the North Sea (Brent) in dollars came down (-4.3% after +2.4%), despite the strained geopolitical climate in the Middle-East. In euros, the Brent price declined too (3.7% after +3.5%).
Prices of industrial raw materials increased
In July, prices of industrial raw materials in euros ramped up (+4.8% after +0.3% in June). Prices of agricultural raw materials recovered (+3.0% after -0.5%), especially those of sawn softwood (+9.2% after -4.4%), in spite of the fall in cotton prices (-7.3% from -0.7%), marked by plentiful crops in the USA and in India. Prices of minerals boosted (+5.5% after +0.6%). Prices of non-ferrous metals came up more sharply (+5.8% after +2.2%), on account of the sharp increase in copper prices (+5.3% from –0.1%) and of the dynamism in aluminum prices (+6.8% from +6.2%). Prices of iron ore picked up (+4.3% after -6.8%).
Prices of precious metals kept climbing (+4.4% from +1.5%), due to the rise in gold prices (+3.2% after +0.4%), viewed as an offset value in times of tensions. Palladium prices kept increasing (+5.3% from +2.6%).
Prices of raw food materials dipped
In July, prices of raw food materials in euros slid (-1.6% after +1.4%). Prices of oil seeds and vegetable oils plummeted (–9.9% after -1.4%), in particular those of sunflower oil (-3.8% after -0.3%), but especially those of soybeans (-10.1% from –2.6%), on account of abundant american crops. Prices of Cereals shrank as well (-2.7% after -0.8%), in particular those of maize that went down sharply (-13.6% from -7.7%), as a result of a high crop output level in the USA. Within the tropical foodstuffs, arabica prices ceased declining (+0.4% from -7.3%), thanks to a rebalancing between supply and demand. Prices of beef meat were still borne by a favourable momentum (+8.5% after +6.2%), on account of a marked demand in Asia.
tableautabpetrole – Oil and petroleum products
| Prices | Change (%) | |||
|---|---|---|---|---|
| of last month | over the last month | over the last 3 months | over the last 12 months | |
| Brent in $ per barrel | 107.0 | –4.3 | –0.9 | –0.6 |
| Brent in € per barrel | 79.2 | –3.7 | 1.4 | –3.7 |
| Gasoline €/L | 0.55 | –3.5 | –0.8 | –6.8 |
| Gas Oil | 658.6 | –1.8 | 0.2 | –5.5 |
| Heavy fuel | 453.3 | –2.4 | –0.2 | –2.0 |
| Naphtha | 698.9 | –0.3 | 4.2 | 4.2 |
- Prices are in euros per tonne unless otherwise specified
- Source : Insee
tableautabmatprem_ang – Imported raw materials (excluding energy) in euros
| Index | Changes (%) | |||
|---|---|---|---|---|
| over the last month | over the last 3 months | over the last 12 months | ||
| Food total | 194.3 | –1.6 | –0.1 | 1.7 |
| Tropical foodstuffs | 181.3 | 2.0 | 3.4 | 27.8 |
| Oil seeds, vegetable oils | 219.3 | –9.9 | –10.4 | –17.3 |
| Cereals | 137.8 | –2.7 | –4.9 | –28.5 |
| Sugar | 142.6 | 0.5 | 3.5 | 1.7 |
| Beef meat | 154.6 | 8.5 | 15.8 | 29.8 |
| Industrial raw materials | 161.4 | 4.8 | 4.6 | 2.0 |
| Agricultural raw materials | 106.0 | 3.0 | 2.9 | 3.5 |
| Natural Fibers | 117.4 | –6.5 | –7.7 | –11.1 |
| Natural rubber | 179.2 | –0.1 | –3.4 | –25.6 |
| Hides | 92.4 | 1.1 | –0.8 | 5.9 |
| Wood pulp | 93.2 | 1.0 | 2.7 | 4.6 |
| Tropical wood | 105.4 | 1.7 | 4.3 | 9.0 |
| Sawn softwood | 94.0 | 9.2 | 6.4 | 9.0 |
| Minerals | 191.4 | 5.5 | 5.1 | 1.4 |
| Iron ore | 526.8 | 4.3 | –14.2 | –26.8 |
| Non-ferrous metals | 155.7 | 5.8 | 10.2 | 9.6 |
| Precious metals | 236.8 | 4.4 | 6.4 | 3.2 |
| All commodities | 166.6 | 2.1 | 2.6 | 2.0 |
- Source : Insee
graphiqueG_petrole_ang – Oil

- Source : Insee
graphiqueG_alim_ang – Food
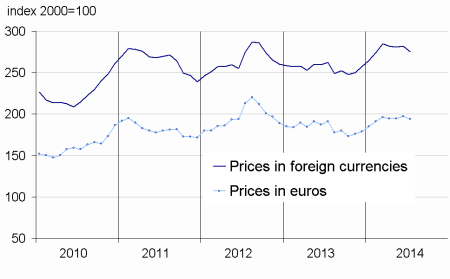
- Source : Insee
graphiqueG_ensemble_ang – All commodities
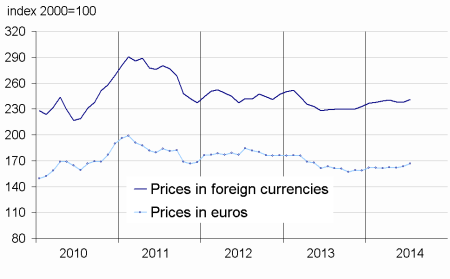
- Source : Insee
graphiqueG_indus_ang – Industrial raw materials
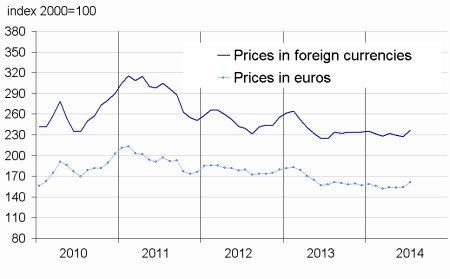
- Source : Insee
Pour en savoir plus
Time series : Raw materials prices
