


 26 August 2015
2015- n° 200Decline in business start-ups in July 2015 Enterprise births - July 2015
26 August 2015
2015- n° 200Decline in business start-ups in July 2015 Enterprise births - July 2015
In July 2015, the number of business births fell back sligthly (–0.6% for all entreprises, seasonally and working-day adjusted). A further decrease in self-managed micro-entrepreneurs’ registrations was partly lessened by a steady rose in business start-ups excluding self-managed micro-entrepreneurs (+1.7% in July and +16.9% since October 2014).
In July 2015, the number of business births fell back sligthly (–0.6% for all entreprises, seasonally and working-day adjusted). A further decrease in self-managed micro-entrepreneurs’ registrations was partly lessened by a steady rose in business start-ups excluding self-managed micro-entrepreneurs (+1.7% in July and +16.9% since October 2014).
–5.2% year-on-year (quarterly basis)
The raw amount of births added up in the last three months went down compared to the same months one year before (–5.2% for all enterprises and –24.6% for self-managed micro-entrepreneurs alone). The sectors that most contributed1 to that decrease were construction and trade.
–2.0% year-on-year (twelve months basis)
During the last twelve months, the raw number of business start-ups decreased (–2.0% year-on-year), due to the fall in self-managed micro-entrepreneurs set-ups (–10.2%). This drop was partly offset by the rise in other enterprises.
Barely half of business set-ups are self–managed micro-entrepreneurs
In July 2015, 46.7% of business set-ups over the last twelve months were micro–entrepreneurs’ registrations.
tableautab0EN – Business set-ups distribution by type
| May 2015 | June 2015 | July 2015 | |
|---|---|---|---|
| Companies | 30.9 | 31.2 | 31.5 |
| Sole proprietorships excluding self-managed micro-entrepreneurs | 20.6 | 21.2 | 21.8 |
| Self-managed micro-entrepreneurs | 48.5 | 47.6 | 46.7 |
- Source: INSEE (Sirene)

1 The contribution of a sector to the overall variation is the observed variation of this sector, weighted by the share of this sector in the total number of births.
graphiqueGraph1EN – Business start-ups (sa-wda *)
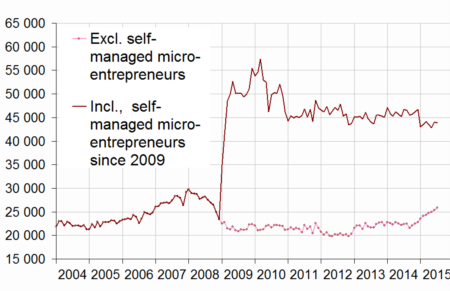
- * Seasonally and working-day adjusted data
- Source: INSEE (Sirene)
graphiqueGraph2EN – Trade and business support activities start-ups (sa-wda *)
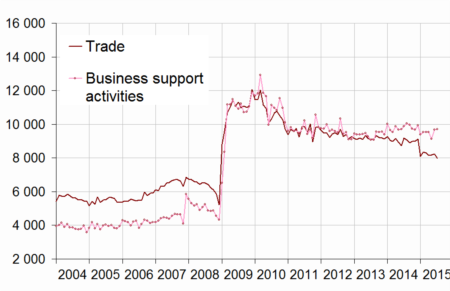
- * Seasonally and working-day adjusted data
- Source: INSEE (Sirene)
graphiqueGraph3EN – Construction and real estate business start-ups (sa-wda *)
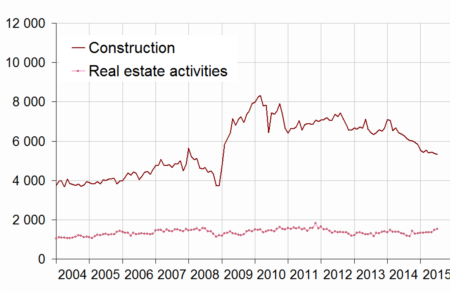
- * Seasonally and working-day adjusted data
- Source: INSEE (Sirene)
tableautab1EN – Business set-ups by month (sa-wda *)
| April 2015 | May 2015 | June 2015 | July 2015 | |
|---|---|---|---|---|
| Excl. self-managed micro-entrepreneurs | 24,763 | 24,972 | 25,412 | 25,848 |
| Variation [m-o-m] % | 1.5 | 0.8 | 1.8 | 1.7 |
| Incl. self-managed micro-entrepreneurs | 43,548 | 42,813 | 44,089 | 43,803 |
| Variation [m-o-m] % | –1.3 | –1.7 | 3.0 | –0.6 |
- * Seasonally and working-day adjusted data
- Source: INSEE (Sirene)
tableautab2EN – Business start-ups by type
| Moving total % change * | Moving total | Moving total | ||
|---|---|---|---|---|
| over 3 months | over 12 months | January- July 2015 | January- July 2014 | |
| Total | –5.2 | –2.0 | 313,560 | 331,401 |
| Companies | 5.5 | 3.3 | 102,817 | 100,560 |
| Sole proprietorships | –9.9 | –4.3 | 210,743 | 230,841 |
| Of which self-managed micro-entrepreneurs | –24.6 | –10.2 | 132,798 | 167,343 |
- * Total of business start-ups during the last 3 or 12 months compared with the same months a year earlier
- Source: INSEE (Sirene)
tableautab3EN – Number of business set-ups (incl. self-managed micro-enterprises)
| NA | May 2015 | June 2015 | July 2015 | |
|---|---|---|---|---|
| Total | 42,813 | 44,089 | 43,803 | |
| Industry | BE | 2,003 | 1,992 | 1,995 |
| Of which Manufacturing | C | 1,737 | 1,743 | 1,766 |
| Construction | FZ | 5,437 | 5,378 | 5,323 |
| Wholesale and retail trade, Transport, Accommodation and Food and beverage activities | GI | 11,970 | 12,158 | 12,041 |
| Of which Trade | G | 8,185 | 8,236 | 7,968 |
| Of which Transportation and storage | H | 1,350 | 1,588 | 1,580 |
| Of which Accommodation and food service activities | I | 2,325 | 2,356 | 2,393 |
| Information and communication | JZ | 2,101 | 2,142 | 2,073 |
| Financial and insurance activities | KZ | 1,322 | 1,329 | 1,339 |
| Real estate activities | LZ | 1,361 | 1,479 | 1,517 |
| Business support activities | MN | 9,116 | 9,662 | 9,718 |
| Public administration and defence, education, human health and social work activities | OQ | 5,312 | 5,668 | 5,804 |
| Other services activities | RS | 4,192 | 4,282 | 3,993 |
- * Seasonally and working-day adjusted data
- Source: INSEE (Sirene)
tableautab3bisEN – Fluctuation in the number of business set-ups (incl. self-managed micro-entrepreneurs)
| NA | July 15 / June 15 | Moving total % change** | ||
|---|---|---|---|---|
| sa-wda * | over 3 months | over 12 months | ||
| Total | –0.6 | –5.2 | –2.0 | |
| Industry | BE | 0.2 | –16.8 | –8.8 |
| Of which Manufacturing | C | 1.3 | –19.4 | –9.2 |
| Construction | FZ | –1.0 | –16.4 | –13.9 |
| Wholesale and retail trade, Transport, Accommodation and Food and beverage activities | GI | –1.0 | –4.1 | –0.4 |
| Of which Trade | G | –3.3 | –9.0 | –6.3 |
| Of which Transportation and storage | H | –0.5 | 42.3 | 45.9 |
| Of which Accommodation and food service activities | I | 1.6 | –5.9 | 2.2 |
| Information and communication | JZ | –3.2 | –5.7 | 0.1 |
| Financial and insurance activities | KZ | 0.7 | 14.2 | 12.5 |
| Real estate activities | LZ | 2.6 | 10.7 | 0.0 |
| Business support activities | MN | 0.6 | –3.4 | 0.3 |
| Public administration and defence, education, human health and social work activities | OQ | 2.4 | 3.5 | 6.3 |
| Other services activities | RS | –6.7 | –8.9 | –5.3 |
- * Seasonally and working-day adjusted data
- ** Total of business start-ups during the last 3 or 12 months compared with the same months a year earlier
- Source: INSEE (Sirene)
Pour en savoir plus
Time series : Business demography
