


 31 March 2015
2015- n° 76After rising for three months, household consumption expenditure on goods was broadly
stable in February (+0.1%) Household consumption expenditure on goods - February 2015
31 March 2015
2015- n° 76After rising for three months, household consumption expenditure on goods was broadly
stable in February (+0.1%) Household consumption expenditure on goods - February 2015
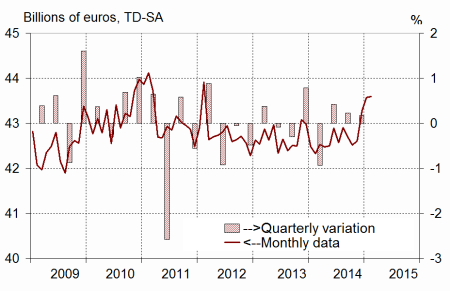
In February 2015, household consumption expenditure on goods was broadly stable: +0.1% in volume*, after +0.7% in January. The high vigour of spending on energy and other engineered goods was offset by a slight decline in the consumption of clothes and cars.
In February 2015, household consumption expenditure on goods was broadly stable: +0.1% in volume*, after +0.7% in January. The high vigour of spending on energy and other engineered goods was offset by a slight decline in the consumption of clothes and cars.
Engineered goods : virtually stable
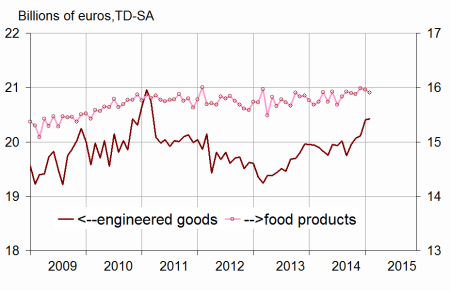
In February, household consumption of engineered goods was virtually stable (+0.1% after +1.5%).
Durables: near stability
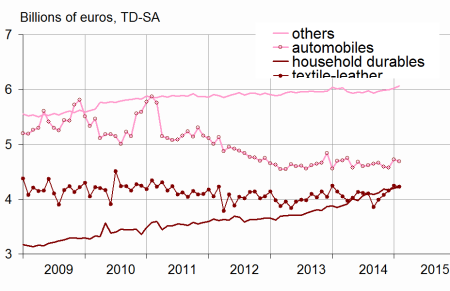
Household expenditure on durable goods was also practically stable in February (-0.1% after +1.8%). In detail, expenditure on cars decreased (-0.8% after +3.4% in January), while expenditure on household durables kept growing (+0.5% after +1.0% in January).
Textile-leather: slight drop
Consumption of textile, clothing and leather slightly decreased in February (-0.4% after +2.0%), for the first time since September 2014.
Other engineered goods: increasing
In February, consumption expenditure on other engineered goods sped up slightly (+0.7%, after +0.5% in January), especially due to expenditure on perfumes and hardware.
[* Volumes are chained and all figures are trading days and seasonally adjusted.]
graphiquegraph1_new_ang – Total consumption of goods
graphiquegraph2_new_ang – Food and engineered goods
graphiquegraph3_new_ang – Breakdown of engineered goods
Food products: decreasing
Consumption of food products decreased slightly in February (–0.3% after –0.1% in January), mainly as a result of the decline in tobacco expenditure.
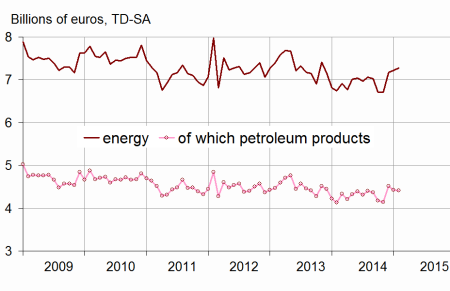
Energy: slight acceleration
Household consumption of energy products accelerated slightly in February (+0.8% after +0.6%). This dynamism essentially reflected high level in heating expenditure, the temperatures being slightly below seasonal norms in February. By contrast, fuel expenditure declined again, but at a lower pace.
The variation in January is scaled up by 0.1 point
The growth in household consumption of goods in January 2015 is scaled up by 0.1 point: it is now estimated at +0.7%, instead of +0.6% within the previous publication.
This revision is mainly due to the integration of new information, as well as the updating of the seasonal adjustment coefficients.
graphiquegraph4_new_ang – Energy
tableautab1_eng – Household consumption expenditure on goods
| Dec. | Jan. | Feb. | Feb.2015/ | |
|---|---|---|---|---|
| 2014 | 2015 | 2015 | Feb.2014 | |
| Food products | 15.986 | 15.962 | 15.908 | |
| Change (%) | 0.7 | –0.1 | –0.3 | 1.4 |
| Engineered goods | 20.113 | 20.408 | 20.422 | |
| Change (%) | 0.3 | 1.5 | 0.1 | 2.4 |
| Durables | 9.959 | 10.143 | 10.132 | |
| Change (%) | –0.4 | 1.8 | –0.1 | 3.5 |
| - of which automobiles | 4.568 | 4.723 | 4.686 | |
| Change (%) | –0.4 | 3.4 | –0.8 | –0.2 |
| - of which household durables | 4.161 | 4.202 | 4.222 | |
| Change (%) | –0.5 | 1.0 | 0.5 | 9.7 |
| Textile-leather | 4.160 | 4.241 | 4.225 | |
| Change (%) | 2.0 | 2.0 | –0.4 | 2.2 |
| Other engineered goods | 5.993 | 6.022 | 6.063 | |
| Change (%) | 0.1 | 0.5 | 0.7 | 0.8 |
| Energy | 7.173 | 7.217 | 7.274 | |
| Change (%) | 6.9 | 0.6 | 0.8 | 7.9 |
| - including petroleum products | 4.516 | 4.425 | 4.409 | |
| Change (%) | 9.0 | –2.0 | –0.3 | 6.6 |
| Total | 43.268 | 43.571 | 43.593 | |
| Change (%) | 1.6 | 0.7 | 0.1 | 3.0 |
| Manufactured goods | 37.176 | 37.272 | 37.225 | |
| Change (%) | 1.3 | 0.3 | –0.1 | 2.4 |
Documentation
Methodology (pdf,23 Ko)
Pour en savoir plus
