


 23 January 2015
2015- n° 12In the fourth quarter 2014, production capacity loosens in the manufacturing industry Quarterly business survey (goods-producing industries) - January 2015
23 January 2015
2015- n° 12In the fourth quarter 2014, production capacity loosens in the manufacturing industry Quarterly business survey (goods-producing industries) - January 2015
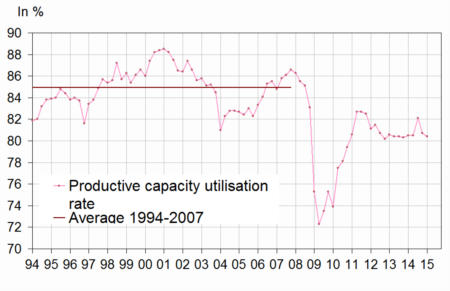
In January 2015, the industrialists have announced less tight production capacity. The productive capacity utilization rate (TUC) slightly decreased compared to the previous quarter. Since the third quarter 2008, it has remained below its average level: production capacities are less used in the manufacturing industry than there were on average between 1994 and 2007. The balance on production bottlenecks is nearly stable, at its long-term average.
Decreased pressure on production capacity
In January 2015, the industrialists have announced less tight production capacity. The productive capacity utilization rate (TUC) slightly decreased compared to the previous quarter. Since the third quarter 2008, it has remained below its average level: production capacities are less used in the manufacturing industry than there were on average between 1994 and 2007. The balance on production bottlenecks is nearly stable, at its long-term average.
graphiqueGraphang2 – Change in the productive capacity utilisation rate
Global demand is deemed slightly lower than before
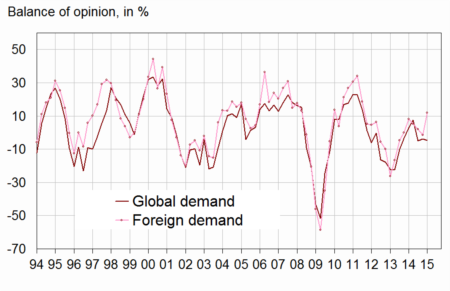
In the fourth quarter 2014, the balance of opinion on global demand in the manufacturing industry slightly declined, below its long-term average. By contrast, the balance of opinion on foreign demand increased and went back above its long-term average. Over the next three months, the industrialists are more pessimistic than in October on global demand, but more optimistic on foreign one.
graphiqueGraphang1 – Balance of opinion of past change in demand
tableautableau1 – Industrialists' opinion : demand and production factors
| Manufacturing industry | Aver.* | April 14 | July 14 | Oct. 14 | Jan. 15 |
|---|---|---|---|---|---|
| Global demand | |||||
| Past change | 0 | 7 | –5 | –4 | –5 |
| Future change | 1 | 5 | 3 | 4 | 1 |
| Foreign demand | |||||
| Past change | 3 | 5 | 2 | –2 | 12 |
| Future change | 4 | 7 | 9 | 2 | 5 |
| Production factors | |||||
| Production bottlenecks (in %) | 22 | 26 | 23 | 22 | 23 |
| Assessment of productive capacity | 14 | 12 | 16 | 18 | 14 |
| Productive capacity utilisation rate (in %) | 84,6 | 80,5 | 82,1 | 80,7 | 80,4 |
| Difficulties of supply and demand | |||||
| Difficulties of supply and demand | 8 | 12 | 11 | 11 | 9 |
| Difficulties of supply | 20 | 14 | 16 | 16 | 14 |
| Difficulties of demand | 44 | 47 | 40 | 49 | 43 |
- * : Long-term average since 1976.
- The results of the last survey are preliminary.
- Source: Quaterly business survey - INSEE
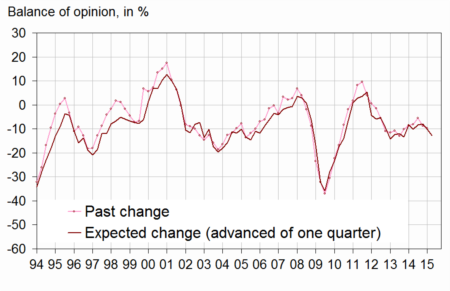
Further reduction of the workforce
According to business managers, the rate of job losses in the industry is slightly faster compared to the previous quarter. However, the balance of opinion remains slightly above its long-term average. Over the next few months, industrialists consider that workforce is likely decreased again; the corresponding balance of opinion remains at its long-term average.
About a quarter of the industrialists has hiring difficulties, a part which remains stable and slightly below its long-term average.
graphiqueGraphang3 – Workforce size in the manufacturing industry
A slight increase in wages
According to the business managers in the manufacturing industry, wages increased by 0.3% over the fourth quarter 2014.
The balance on the weekly working time went up. More industrialists anticipate a rise of this working time over the next few months.
Selling prices decreased
Almost as many industrialists experienced cash-flow problems in the fourth quarter 2014 (12%) than in the third one (13%). The corresponding balance of opinion stands below its normal level (15%).
According to business managers, the selling prices in the manufacturing industry went down again in the fourth quarter 2014. They forecast a new decrease in selling prices for the next quarter.
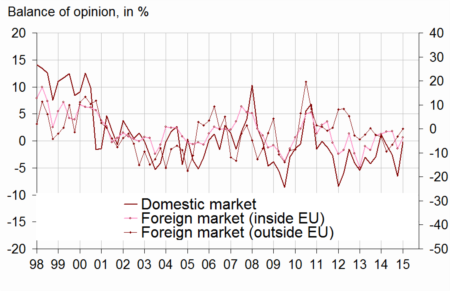
A better balance of opinion on competitive position
Industrialists considered that in the fourth quarter 2014, their competitive position increased on the whole market. The corresponding balances of opinion on domestic and outside European markets stand close to their normal level, whereas European market one remains low compared to its long-term average.
The general exportation expectations have sharply gone up: the corresponding balance increased by 13 points after a rise of 8 points in the previous quarter. It stands above its long-term average.
graphiqueGraphang4 – Competitive position
tableautableau2 – Industrialists'opinion : employment, competitive position, cash-flow, wags and selling prices
| Manufacturing industry | Aver.* | April 14 | July 14 | Oct. 14 | Jan. 15 |
|---|---|---|---|---|---|
| Workforce size | |||||
| Past change | –11 | –8 | –6 | –9 | –10 |
| Expected change | –13 | –8 | –8 | –10 | –13 |
| Difficulties hiring | 28 | 27 | 27 | 26 | 26 |
| Working time | |||||
| Past change | –3 | –1 | –1 | –2 | 1 |
| Expected change | –5 | –1 | –3 | –2 | –1 |
| Cash-flow and wages | |||||
| Cash-flow problems | 15 | 13 | 14 | 13 | 12 |
| Past wages | 0,5 | 0,3 | 0,4 | 0,3 | 0,3 |
| Selling prices | |||||
| Past change | 0,1 | 0,0 | –0,2 | –0,6 | –1,1 |
| Expected change | 0,2 | –0,2 | –0,1 | –0,5 | –1,0 |
| Competitive position | |||||
| On domestic market | 1 | –1 | –3 | –7 | 0 |
| On foreign markets inside EU | –1 | –1 | –1 | –8 | –4 |
| On foreign markets outside EU | –1 | –9 | –7 | –3 | 0 |
| General exportation expectations | –10 | –10 | –23 | –15 | –2 |
- * : Long-term average since 1976.
- The results of the last survey are preliminary.
- A quantitative question is asked about selling prices and past wage.
- Source : Quaterly business survey - INSEE
Documentation
Methodology (pdf,48 Ko)
Pour en savoir plus
Time series : Industry
