


 14 October 2014
2014- n° 234Consumer prices decreased by 0.4% in September 2014; they rose by 0.3% year-on-year Consumer price index - final results - September 2014
14 October 2014
2014- n° 234Consumer prices decreased by 0.4% in September 2014; they rose by 0.3% year-on-year Consumer price index - final results - September 2014
The Consumer Prices Index (CPI) decreased by 0.4% in September 2014, after rising by +0,4% in August. Seasonally adjusted, it diminished by 0.1% after +0.1% in August 2014. Year-on-year, the CPI grew by 0.3%, slightly down from the previous month (+0.4% in August 2014). Excluding tobacco, the CPI increased by 0.2%, year-on-year.
Monthly change: —0.4%; Year-on-year: +0.3%
The Consumer Prices Index (CPI) decreased by 0.4% in September 2014, after rising by +0,4% in August. Seasonally adjusted, it diminished by 0.1% after +0.1% in August 2014. Year-on-year, the CPI grew by 0.3%, slightly down from the previous month (+0.4% in August 2014). Excluding tobacco, the CPI increased by 0.2%, year-on-year.
The largest contributions to the drop in the CPI in September 2014 came from seasonal decreases in prices of some services at the end of the summer holidays and also from a new fall in energy prices. Conversely, prices of manufactured products, especially those of clothing and footwear, continued to recover after the end of summer sales in metropolitan France. Moreover, food prices overall increased, driven by a strong growth in fresh food prices in September 2014.
Decrease in service prices
In September 2014, service prices fell by 1.6% (+1.5% year-on-year), mainly as a result of the seasonal drop in prices of tourism services. Particularly, it was the case for accommodation services (—43.7%; +0.3% year-on-year), package holidays (—27.3%; +1.6% year-on-year), rents of vacation residences (—24.5%; +1.0% year-on-year), airfares (—18.3%; +1.6% year-on-year) and passenger transport by sea and inland waterway (—14.7%; —2.4% year-on-year). Furthermore, while telecommunication tariffs remained almost stable during the last months, they dipped again year-on-year (—3.2%). In addition, service charges for insurance broadly fell by 1.0% in September 2014 due to promotion campaigns (+1.3% year-on-year).
tableauOLE_LINK2 – Detailed figures for various groups
| Weight | Index | Percentage change | |||
|---|---|---|---|---|---|
| Items | 2014 | Sept. 2014 | m-on-m change | y-on-y change | |
| a) All households - France | |||||
| All items (00 E) | 10000 | 127.80 | -0.4 | 0.3 | |
| All items SA (00 C) | 10000 | 128.05 | -0.1 | 0.3 | |
| Food (4000 E) | 1653 | 131.33 | 0.4 | -0.6 | |
| Fresh food (4001 E) | 210 | 135.74 | 4.9 | -2.1 | |
| Food excluding fresh products (4002 E) | 1443 | 130.67 | -0.2 | -0.4 | |
| Tobacco (4034 E) | 204 | 258.61 | 0.0 | 3.5 | |
| MANUFACTURED PRODUCTS (4003 E) | 2653 | 100.74 | 1.2 | -0.7 | |
| Clothing and footwear (4004 E) | 438 | 111.95 | 6.1 | 0.5 | |
| Medical products (4005 E) | 434 | 78.15 | 0.0 | -2.9 | |
| Other manufactured products (4006 E) | 1781 | 103.8 | 0.3 | -0.4 | |
| ENERGY (4007 E) | 850 | 176.82 | -0.2 | -2.5 | |
| Petroleum products (4008 E) | 475 | 199.84 | -0.3 | -4.8 | |
| SERVICES (4009 E) | 4640 | 135.75 | -1.6 | 1.5 | |
| Actual rentals and services for dwellings (4010 E) | 748 | 141.73 | 0.0 | 1.4 | |
| Medical services (4011 E) | 552 | 121.79 | -0.1 | 0.4 | |
| Transport and communication services (4012 E) | 503 | 95.43 | -4.0 | -0.1 | |
| Other services (4013 E) | 2837 | 146.64 | -1.8 | 2.1 | |
| ALL ITEMS EXCLUDING RENTALS AND TOBACCO (5000 E) | 9202 | 125.22 | -0.4 | 0.2 | |
| ALL ITEMS EXCLUDING TOBACCO (4018 E) | 9796 | 125.88 | -0.4 | 0.2 | |
| b) Manual or clerical worker headed urban households - France | |||||
| ALL ITEMS EXCLUDING TOBACCO (4018 D) | 9707 | 125.64 | -0.4 | 0.2 | |
| ALL ITEMS (00 D) | 10000 | 128.44 | -0.4 | 0.3 | |
| c) Households that belong to the lowest equivalized disposable income quintile - France | |||||
| ALL ITEMS EXCLUDING TOBACCO (4018 Q) | 9679 | 126.93 | -0.5 | 0.1 | |
- Source : Insee - Consumer Price Indexes
tableauTableau1English – Detailed figures for Core inflation* and HICP**
| Percentage change | ||||
|---|---|---|---|---|
| Items | Weight 2014 | Index Sept. 2014 | m-o-m change | y-o-y change |
| All items "Core inflation" (4022 S) | 6053 | 122.45 | -0.3 | 0.0 |
| Food excluding fresh products, meat, milk and exotic products (4019 S) | 713 | 124.63 | 0.0 | -1.1 |
| Manufactured products (4020 S) | 2162 | 104.78 | 0.2 | -0.6 |
| Services including actual rentals and services for dwellings (4021 S) | 3178 | 139.43 | -0.5 | 0.8 |
| All items HICP (00 H) | 115.55 | -0.4 | 0.4 | |
- * ISJ : Core inflation indicator excludes public sector prices, the most volatile consumer prices and the tax measures. Seasonally adjusted, this index is calculated for all households in France excluding overseas departments and territories (base 100 1998).
- **HICP : Harmonised Indices of Consumer Prices are inflation figures designed for international comparison of consumer price inflation between Member states of the European Union. This index is calculated for all households in France (base 100 2005).
- Source : Insee - Consumer Price Indexes
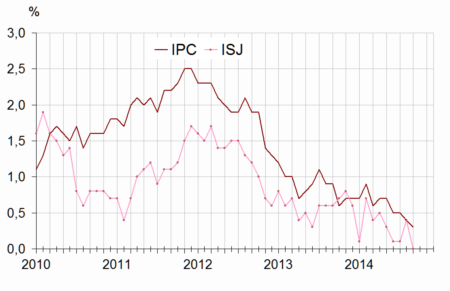
graphiqueGraphique1English – Consumer price index (IPC) and Core inflation (ISJ) – year-on-year changes
- Source : Insee - Consumer Price Indexes
New decline in energy prices
Energy prices decreased again in September 2014, but in a lesser manner than in August (—0.2% after —0.8%). Compared to September 2013, they dropped by 2.5%. Manufactured gas prices declined again (—0.6% in September after —1.2% in August; —3.6% year-on-year) as well as those of petroleum products (—0.3% in September after —1.1% in August; —4.8% year-on-year). Electricity prices remained steady in September 2014; they increased by +2.7% year-on-year, as in August.
Manufactured product prices rose again after the end of summer sales
After the end of summer sales in metropolitan France, prices of manufactured products went on increasing : +1.2% in September 2014 after +1.9% in August. In particular, prices of clothing and footwear increased by 6.1% in September 2014 (after +10.6% in August; +0.5% year-on-year). Compared to last year, prices of manufactured produts overall declined by 0.7%. Some of them were still discounted after the summer sales. It was the case for perfumes, care and beauty products (—0.5% in September 2014; —1.1% year-on-year), for household appliances (—0.2%; —2.0% year-on-year), for mattresses and bedding (—0.4% in September; —0.3% year-on-year) and for furniture and furnishings for bedroom (—0.5% in September 2014; +0.3% year-on-year). In addition, the declining trend in prices of some high tech products (computers, photographic equipment) has continued. On the opposite, following the end of special offers, prices of new cars increased by 1.5% in September 2014 (+4.1% year-on-year).
Prices of food products bounced back
In September 2014, food prices increased by 0.4% after having diminishing by 0.5% in August and July 2014. Year-on-year, their decline (—0.6% in September 2014) was lower than during the last months (—1.5% in August). This rebound came from a recovery in unprocessed food prices (+4.9% in September 2014) after their strong fall during the last months. However, this tendency was far to be homogeneous, especially for fresh vegetable prices which price trends differed depending on products. Excluding unprocessed products, food prices continued to diminish, by 0.2% in September 2014 and by 0.4% year-on-year (as in August 2014).
Core inflation decreased in September 2014
In September 2014, core inflation (ISJ) decreased by 0.3%. It reached zero year-on-year, the lowest level of this indicator (computed from 1990). The Harmonized Index of Consumer Prices (HICP) decreased by 0.4% in September and grew by 0.4% year-on-year, after +0.5% in August 2014.
Pour en savoir plus
