


 12 September 2014
2014- n° 210Slight decrease in business start-ups in August 2014 Enterprise births - August 2014
12 September 2014
2014- n° 210Slight decrease in business start-ups in August 2014 Enterprise births - August 2014
In August 2014, the number of business start-ups including self-managed enterprises seasonally and working-day adjusted data (sa-wda) slightly moved back compared to July by -0.3% for all business starts-up but increased somewhat (+0.2%) excluding self-managed enterprises.
In August 2014, the number of business start-ups including self-managed enterprises seasonally and working-day adjusted data (sa-wda) slightly moved back compared to July by -0.3% for all business starts-up but increased somewhat (+0.2%) excluding self-managed enterprises.
+2.8% year-on-year (quarterly basis)
The amount of entries added up in the last three months increased compared to the same months one year before (+2.8%), specially for companies (+3.8%).
The sectors that most contributed to that growth were business support activities; education, health and social work activities and also accommodation, food and be-verage service activities.
+2.1% year-on-year (twelve months basis)
During the last twelve months, the number of business start-ups rose by 2.1% year-on-year, especially the number of companies increased (+3.9%).
More than half of the creations are self-managed enterprises
In August 2014, 51.0% of business set-ups over the last twelve months were self-managed enterprises.
tableautab0EN – Business set-ups distribution by type (%)
| June 2014 | July 2014 | Aug. 2014 | |
|---|---|---|---|
| Companies | 30.0 | 29.9 | 29.9 |
| Individual enterprises excl. self-managed business | 19.2 | 19.2 | 19.0 |
| Self-managed business | 50.8 | 50.9 | 51.0 |
- Source: INSEE (Sirene)
tableautab1EN – Business set-ups by month
| May 2014 | June 2014 | July 2014 | Aug. 2014 | |
|---|---|---|---|---|
| Excl. self-managed enterprises (sa-wda *) | 22 625 | 22 417 | 22 776 | 22 820 |
| Variation [m-o-m] % | -1.3 | -0.9 | 1.6 | 0.2 |
| Incl., self-managed enterprises (sa-wda *) | 45 464 | 45 283 | 46 841 | 46 687 |
| Variation [m-o-m] % | -1.6 | -0.4 | 3.4 | -0.3 |
- * Seasonally and working-day adjusted data
- Source: INSEE (Sirene)
tableautab2EN – Business start-ups by type
| Moving total % change* | Moving total | Moving total | ||
|---|---|---|---|---|
| over 3 months | over 12 months | January- August 2014 | January- August 2013 | |
| Total | 2.8 | 2.1 | 364 904 | 357 745 |
| Companies | 3.8 | 3.9 | 110 768 | 106 342 |
| Individual enterprises | 2.4 | 1.3 | 254 136 | 251 403 |
| Of which self-managed | 4.8 | -0.9 | 184 614 | 181 344 |
- * Total of business start-ups during the last 3 or 12 months compared with the same months a year earlier
- // = meaningless
- Source: INSEE (Sirene)
graphiqueGraph1EN – Business start-ups
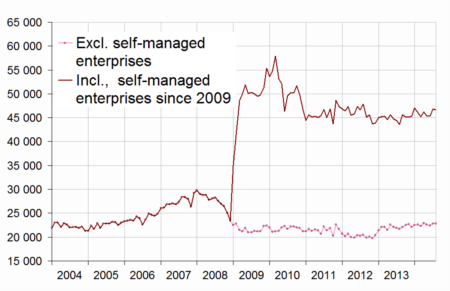
- * Seasonally and working-day adjusted data
- Source: INSEE (Sirene)
Pour en savoir plus
Time series : Business demography
