


 27 October 2014
2014- n° 248In October 2014, the demand for new dwellings decreases again Quaterly business survey in the real-estate development - October 2014
27 October 2014
2014- n° 248In October 2014, the demand for new dwellings decreases again Quaterly business survey in the real-estate development - October 2014
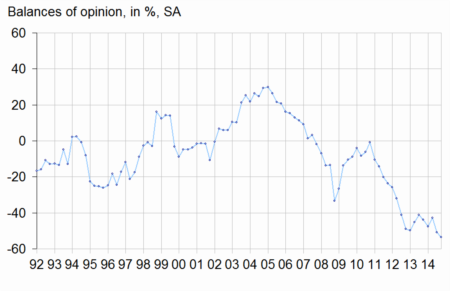
In October 2014, according to developers, the downward trend in the demand for new housing has deepened. The corresponding balance of opinion is significantly below its long-term average and has reached its lowest level since the series is (1991). Expected housing starts stay gloomy for the next three months.

Warning: seasonal coefficients were updated for this survey.
Low demand for new dwellings
In October 2014, according to developers, the downward trend in the demand for new housing has deepened. The corresponding balance of opinion is significantly below its long-term average and has reached its lowest level since the series is (1991). Expected housing starts stay gloomy for the next three months.
Unsold dwelling stock remains high
Even if fewer developers than in July indicate a rise of unsold dwelling stock, the balance of opinion is still sharply above its long-term average.
As many developers as in July indicate a drop in prices
In October, as many developers as in July indicate a fall in average prices of new housing; the corresponding balance of opinion is again significantly below its long-term average. Their opinion about the downpayment to acquire a new dwelling has been less degraded compared to the previous quarter. Slightly fewer developers than in July forecast a decrease in the financing capacity to purchase a new housing.
tableautableau1 – Building construction economic outlook
| Mean* | Jan. 14 | April 14 | July 14 | Oct. 14 | |
|---|---|---|---|---|---|
| New dwelling demand | –8 | –48 | –43 | –51 | –54 |
| Expected housing starts | –7 | –23 | –22 | –34 | –33 |
| - for sale | –15 | –32 | –35 | –42 | –42 |
| - for rent | 0 | –9 | –6 | –15 | –15 |
| Unsold dwelling stock tendency | –27 | –15 | –13 | –10 | –13 |
| Housing average price for sale | 6 | –24 | –22 | –31 | –31 |
| Downpayment | –21 | –41 | –39 | –46 | –40 |
| Financing capacity | –23 | –49 | –47 | –41 | –39 |
- * Mean since July 1991.
- Source: French business survey real-estate development - Insee
graphiqueDemand – New dwelling demand tendency
Pour en savoir plus
