


 17 November 2015
2015- n° 277In October 2015, oil prices picked up slightly Prices of oil and raw material imports - October 2015
17 November 2015
2015- n° 277In October 2015, oil prices picked up slightly Prices of oil and raw material imports - October 2015
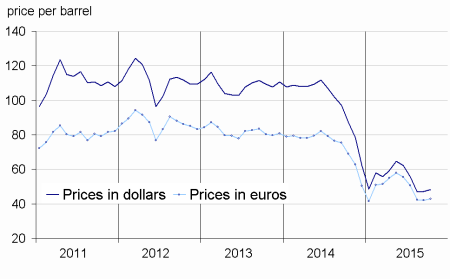
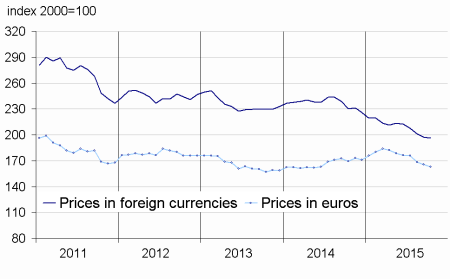
In October 2015, the crude oil price fall in euros recovered slightly (+1.7% after –0.3% in September). Standing at €42.8 on average per barrel of Brent, this price tumbled by 37.8% compared to its level in October 2014 (€68.9). Prices in euros of imported commodities except energy declined again (–1.4% after –1.8%): this shrinkage was driven down by industrial raw materials (–2.9%), while prices of raw food materials increased slightly (+0.8%).
In October 2015, the crude oil price fall in euros recovered slightly (+1.7% after –0.3% in September). Standing at €42.8 on average per barrel of Brent, this price tumbled by 37.8% compared to its level in October 2014 (€68.9). Prices in euros of imported commodities except energy declined again (–1.4% after –1.8%): this shrinkage was driven down by industrial raw materials (–2.9%), while prices of raw food materials increased slightly (+0.8%).
Oil prices in euros recovered a little
The price of crude oil from the North Sea (Brent) in euros picked up slightly (+1.7% after –0.5%), as a result of both a drop in the American no-conventional oil output and a slight demand increase from the importing countries. It also rose in dollars (+1.9% after +0.9%), as the euro was almost unchanged to the American currency.
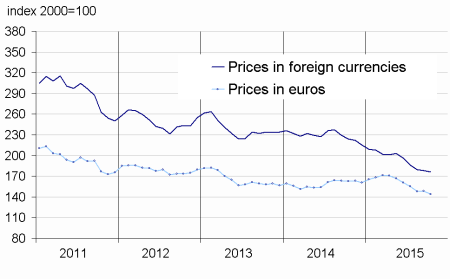
Prices of industrial raw materials fell down
Prices of industrial raw materials in euros dipped (–2.9% after +0.4%), due to a drop in prices of minerals (–3.9%). On the other hand, prices of agricultural raw materials rallied slightly (+1.0% after –4.4%).
Prices of minerals decreased (–3.9% after +1.9%), due to the drop in prices of iron ore (–6.7% after +1.1%) and of non-ferrous metals (–4.2% after +2.4%), in particular those of aluminium. Prices of precious metals recovered (+5.2% after –1.9%), driven up by platinum (+8.5% after –11.0%), gold (+3.1%) and silver (+6.6%).
Prices of agricultural raw materials went up (+1.0% after –4.4%; –3.9% year-on-year). In particular, prices of natural rubber picked up (+1.7% after –10.4%).
Those of sawn softwood recovered sharply (+5.2% after –8.8%)
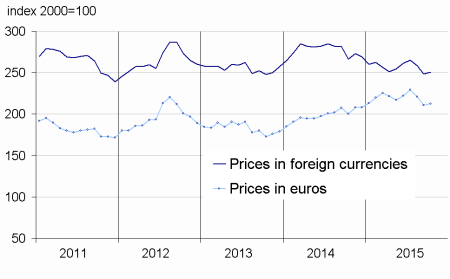
Prices of raw food materials increased slightly
Prices of raw food materials in euros went up slightly (+0.8% after –4.6%). In particular, price of sugar accelerated sharply (+24.8% after +5.2%): heavy rainfalls reduced crops in Brazil; moreover, the other exporting countries (India, Thailand, the Philippines) faced up a drought period of time. Prices of cereals picked up slightly (+0.9% after –2.5%). Prices of beef meat recovered (+3.7% after –12.7%), after a strong decrease over the past three months (–9.4%).
tableautabpetrole – Oil and petroleum products
| Prices | Change (%) | |||
|---|---|---|---|---|
| of last month | over the last month | over the last 3 months | over the last 12 months | |
| Brent in $ per barrel | 48.1 | 1.9 | –13.9 | –44.9 |
| Brent in € per barrel | 42.8 | 1.7 | –15.6 | –37.8 |
| Gasoline €/L | 0.31 | –2.6 | –35.9 | –33.7 |
| Gas Oil | 407.8 | –2.8 | –13.9 | –31.4 |
| Heavy fuel | 226.2 | 2.1 | –18.9 | –40.3 |
| Naphtha | 383.1 | 2.6 | –10.8 | –33.3 |
- Prices are in euros per tonne unless otherwise specified
- Source: INSEE
tableautabmatprem – Imported raw materials (excluding energy) in euros
| Index | Changes (%) | |||
|---|---|---|---|---|
| over the last month | over the last 3 months | over the last 12 months | ||
| Food total | 212.6 | 0.8 | –7.3 | 6.3 |
| Tropical foodstuff | 215.8 | 0.2 | –5.1 | 9.2 |
| Oil seeds, vegetable oils | 233.6 | –1.4 | –10.0 | 8.4 |
| Cereals | 147.7 | 0.9 | –8.3 | 2.9 |
| Sugar | 141.0 | 24.8 | 16.6 | –3.1 |
| Beef meat | 159.8 | 3.7 | –9.4 | 0.3 |
| Industrial raw materials | 144.0 | –2.9 | –7.3 | –11.5 |
| Agricultural raw materials | 107.1 | 1.0 | –8.3 | –3.9 |
| Natural Fibers | 117.4 | 0.1 | –6.5 | 10.3 |
| Natural rubber | 124.7 | 1.7 | –23.4 | –26.9 |
| Hides | 75.2 | –3.1 | –2.3 | –27.3 |
| Wood pulp | 100.3 | –1.2 | –4.4 | 0.6 |
| Tropical wood | 113.8 | –0.2 | –3.4 | 7.7 |
| Sawn softwood | 83.2 | 5.2 | –13.7 | –15.8 |
| Minerals | 164.4 | –3.9 | –6.8 | –13.6 |
| Iron ore | 347.7 | –6.7 | 0.3 | –25.7 |
| Non-ferrous metals | 137.4 | –4.2 | –8.3 | –13.8 |
| Precious metals | 228.5 | 5.2 | 1.6 | 4.5 |
| All commodities | 163.0 | –1.4 | –7.4 | –3.8 |
- Source: INSEE
graphiqueG_petrole_ang – Oil (Brent)
- Source: INSEE
graphiqueG_alim_ang – Food
- Source: INSEE
graphiqueG_ensemble_ang – Imported raw materials (excluding energy)
- Source: INSEE
graphiqueG_indus_ang – Industrial raw materials
- Source: INSEE
Pour en savoir plus
Time series : Raw materials prices
