


 12 November 2015
2015- n° 273In October 2015, consumer prices increased by 0.1%over a month and year-on-year Consumer price index - final results - October 2015
12 November 2015
2015- n° 273In October 2015, consumer prices increased by 0.1%over a month and year-on-year Consumer price index - final results - October 2015
In October 2015, the Consumer Price Index (CPI) increased by 0.1% after –0.4% during the previous month. Seasonally adjusted, it was also up 0.1%. Year-on-year, consumer prices rose slightly (+0.1%) after remaining stable for two months in a row.
Monthly change: +0.1%; Year-on-year: +0.1%
In October 2015, the Consumer Price Index (CPI) increased by 0.1% after –0.4% during the previous month. Seasonally adjusted, it was also up 0.1%. Year-on-year, consumer prices rose slightly (+0.1%) after remaining stable for two months in a row.
The main contributors to the rise in CPI in October came from seasonal price increases in fresh foodstuffs and in some services. They were partially offset by a new decline in energy prices.
Increase in food prices
Food prices increased by 0.5% for the second month in a row. Year-on-year, they still sped up, rising by 1.0% in October after +0.9% in September and +0.8% in August. At this time of year, fresh foodstuffs became more expensive (+3.3% in October; +7.1% year-on-year), especially fresh fruits (+8.3%; +7.4% year-on-year); the increase in fresh vegetable prices was more subdued in October (+0.8%) but remained significant year-on-year (+9.1%). However, prices of fresh fishes and seafood were seasonally lower (–2.7%; +2.1% year-on-year). Excluding unprocessed products, food prices were moderatly up in October (+0,1%) due to a slight rebound in prices of meat (+0.1%), milk, cheese and eggs (+0.2%) and oils and fats (+0.4%). For the first time since June 2014, food prices, excluding fresh foodstuffs, were higher than one year (+0.1%).
tableauOLE_LINK2 – Detailed figures for various groups
| Items | Weight | Index | Percentage change | ||
|---|---|---|---|---|---|
| 2015 | Oct. 2015 | m-on-m change | y-on-y change | ||
| a) All households - France | |||||
| All items (00 E) | 10000 | 127.91 | 0.1 | 0.1 | |
| All items SA (00 C) | 10000 | 128.02 | 0.1 | 0.1 | |
| Food (4000 E) | 1662 | 133.14 | 0.5 | 1.0 | |
| Fresh food (4001 E) | 211 | 150.62 | 3.3 | 7.1 | |
| Food excluding fresh products (4002 E) | 1451 | 130.72 | 0.1 | 0.1 | |
| Tobacco (4034 E) | 199 | 259.27 | 0.0 | 0.3 | |
| MANUFACTURED PRODUCTS (4003 E) | 2584 | 99.84 | 0.0 | –0.7 | |
| Clothing and footwear (4004 E) | 437 | 111.08 | 0.1 | –0.7 | |
| Medical products (4005 E) | 427 | 74.86 | –0.5 | –4.2 | |
| Other manufactured products (4006 E) | 1720 | 103.70 | 0.0 | 0.1 | |
| ENERGY (4007 E) | 815 | 165.39 | –0.6 | –6.1 | |
| Petroleum products (4008 E) | 418 | 169.88 | –0.9 | –13.6 | |
| SERVICES (4009 E) | 4740 | 137.58 | 0.1 | 1.3 | |
| Actual rentals and services for dwellings (4010 E) | 767 | 143.96 | 0.7 | 0.8 | |
| Medical services (4011 E) | 568 | 122.95 | 0.5 | 0.4 | |
| Transport and communication services (4012 E) | 510 | 96.83 | 0.6 | 1.0 | |
| Other services (4013 E) | 2895 | 148.61 | –0.3 | 1.6 | |
| ALL ITEMS EXCLUDING RENTALS AND TOBACCO (5000 E) | 9192 | 125.28 | 0.1 | 0.0 | |
| ALL ITEMS EXCLUDING TOBACCO (4018 E) | 9801 | 125.99 | 0.1 | 0.1 | |
| b) Manual or clerical worker headed urban households - France | |||||
| ALL ITEMS EXCLUDING TOBACCO (4018 D) | 9714 | 125.80 | 0.1 | 0.1 | |
| ALL ITEMS (00 D) | 10000 | 128.61 | 0.1 | 0.1 | |
| c) Households that belong to the lowest equivalized disposable income quintile - France | |||||
| ALL ITEMS EXCLUDING TOBACCO (4018 Q) | 9687 | 126.99 | 0.0 | 0.0 | |
- Source: INSEE - Consumer Price Indexes
tableauTableau1English – Detailed figures for Core inflation* and HICP**
| Items | Weight | Index | Percentage change | |
|---|---|---|---|---|
| 2015 | Oct. 2015 | m-on-m change | y-on-y change | |
| All items "Core inflation" (4022 S) | 6042 | 123.30 | 0.1 | 0.7 |
| Food excluding fresh products, meat, milk and exotic products (4019 S) | 715 | 124.54 | 0.0 | –0.1 |
| Manufactured products (4020 S) | 2103 | 104.47 | 0.2 | –0.1 |
| Services including actual rentals and services for dwellings (4021 S) | 3224 | 141.44 | 0.0 | 1.4 |
| All items HICP (00 H) | 115.76 | 0.1 | 0.2 | |
- * ISJ : Core inflation indicator excludes public sector prices, the most volatile consumer prices and the tax measures. Seasonally adjusted, this index is calculated for all households in France excluding overseas departments and territories (1998: 100).
- **HICP : Harmonised Indices of Consumer Prices are inflation figures designed for international comparison of consumer price inflation between Member states of the European Union. This index is calculated for all households in France (2005: 100).
- Source: INSEE - Consumer Price Indexes
graphiqueGraphique1English – Consumer price index (IPC) and Core inflation (ISJ) – year-on-year changes
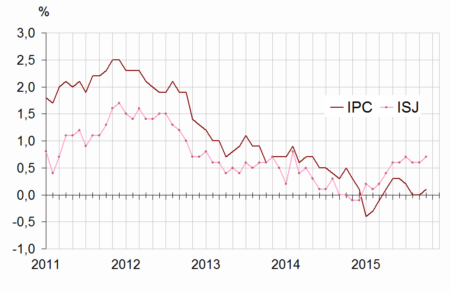
- Source: INSEE - Consumer Price Indexes
Moderate rise in service prices
In October 2015, service prices increased moderately (+0.1%; +1.3% year-on-year, as in September). The actual rentals and dwelling service prices were up seasonally (+0.7%; +0.8% year-on-year) with the
application of winter rates for collective heating. Airfares strengthened (+3.8%; –0.4% year-on-year). Prices of health services grew (+0.5%; +0.4% year-on-year) also in a seasonal manner. These increases were largely offset by the decline, as every year in october, in holiday rentals (–8.9%; +0.9% year-on-year) and in accomodation prices (–3.2%; +1.6% year-on-year).
Stability of manufactured product prices
Prices of manufactured products remained unchanged in October. Year-on-year, they still decreased (–0.7% after –0.9% in September). Clothing and footwear prices went up slightly (+0.1%; –0.7% year-on-year) while prices of medical products continued to fall (–0.5%; –4.2% year-on-year). Prices of the other manufactured products were sluggish (+0.1% year-on-year), albeit with significant price variations in some consumption functions with, especially, the seasonal fall in prices of plants and flowers (–8.4%; stability year-on-year) and the rise in new car prices (+1.9%; +1.2% year-on-year) after the end of special offers.
Further decline in energy prices
Energy prices were down for the fifth month in a row (–0.6% in October; –6.1% year-on-year) mainly due to a new decline in prices of petroleum products (–0.9%; –13.6% year-on-year). Prices of town gas also decreased in October (–1.4%; –5.0% year-on-year). Electricity rates were unchanged in October (+6.3% year-on-year).
Slight rise in core inflation
The core inflation indicator (ISJ) increased slightly compared with September (+0.1%). Year-on-year, it rose by 0.7% in October after +0.6% during the two previous months. The Harmonized Index of Consumer Prices (HICP) was also up 0.1% in October; year-on-year, it grew by 0.2% after +0.1% in August and September.
Pour en savoir plus
