


 16 June 2015
2015- n° 146Further decrease in business start-ups in May 2015 Enterprise births - May 2015
16 June 2015
2015- n° 146Further decrease in business start-ups in May 2015 Enterprise births - May 2015
In May 2015, the number of business start-ups was down again (-1.8% after -1.0% in April) for all enterprises, seasonally and working-day adjusted (sa-wda). The substantial fall in self-managed micro-entrepreneurs births (-5.0% after -4.1%) was partly offset by the rise in other business set-ups (+0.7% after +1.6%).
In May 2015, the number of business start-ups was down again (-1.8% after -1.0% in April) for all enterprises, seasonally and working-day adjusted (sa-wda). The substantial fall in self-managed micro-entrepreneurs births (-5.0% after -4.1%) was partly offset by the rise in other business set-ups (+0.7% after +1.6%).
-5.2% year-on-year (quarterly basis)
The raw amount of births added up in the last three months went down compared to the same same months one year before (-5.2% for all enterprises and -20.2% for self-managed micro-entrepreneurs alone). The sectors that most contributed1 to that decrease were construction and retail.
-1.3% year-on-year (twelve months basis)
During the last twelve months, the raw number of business start-ups decreased (-1.3% year-on-year). The drop in sole proprietorships births (-2.8%) was partly balanced by the rise in companies set-ups (+2.1%).
Nearly half of business set-ups are self–managed micro-entrepreneurs
In May 2015, 48.5% of business set-ups over the last twelve months were micro–entrepreneurs.
tableautab0EN – Business set-ups distribution by type
| March 2015 | April 2015 | May 2015 | |
|---|---|---|---|
| Companies | 30.5 | 30.7 | 30.9 |
| Sole proprietorships excluding self-managed micro-entrepreneurs | 19.6 | 20.1 | 20.6 |
| Self-managed micro-entrepreneurs | 49.9 | 49.2 | 48.5 |
- Source: INSEE (Sirene)

(1) The contribution of a sector to the overall variation is the observed variation of this sector, weighted by the share of this sector in the total number of births.
graphiqueGraph1EN – Business start-ups (sa-wda *)
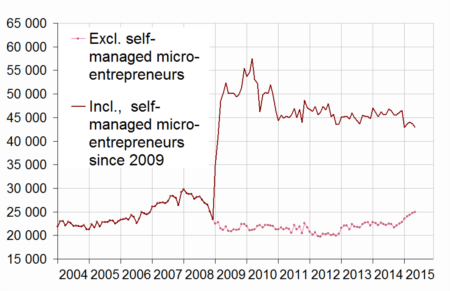
- * Seasonally and working-day adjusted data
- Source: INSEE (Sirene)
graphiqueGraph2EN – Trade and business support activities start-ups (sa-wda *)
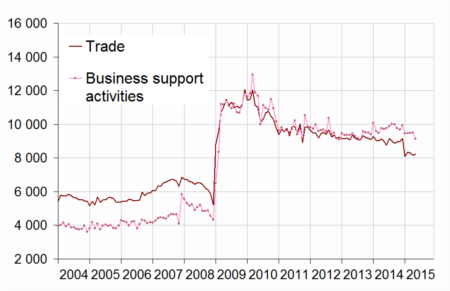
- * Seasonally and working-day adjusted data
- Source : Insee, Sirene
graphiqueGraph3EN – Construction and real estate business start-ups (sa-wda *)
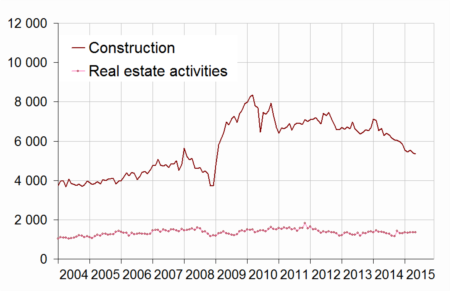
- * Seasonally and working-day adjusted data
- Source : Insee, Sirene
tableautab1EN – Business set-ups by month (sa-wda *)
| Feb. 2015 | March 2015 | April 2015 | May 2015 | |
|---|---|---|---|---|
| Excl. self-managed micro-entrepreneurs | 24,076 | 24,338 | 24,737 | 24,920 |
| Variation [m-o-m] % | 2.4 | 1.1 | 1.6 | 0.7 |
| Incl. self-managed micro-entrepreneurs | 43,614 | 44,086 | 43,666 | 42,899 |
| Variation [m-o-m] % | 1.6 | 1.1 | -1.0 | -1.8 |
- * Seasonally and working-day adjusted data
- Source: INSEE (Sirene)
tableautab2EN – Business start-ups by type
| Moving total % change * | Moving total | Moving total | ||
|---|---|---|---|---|
| over 3 months | over 12 months | January - May 2015 | January - May 2014 | |
| Total | -5.2 | -1.3 | 225,782 | 241,855 |
| Companies | 0.7 | 2.1 | 72,181 | 72,584 |
| Sole proprietorships | -7.8 | -2.8 | 153,601 | 169,271 |
| Of which self-managed micro-entrepreneurs | -20.2 | -5.9 | 97,998 | 122,342 |
- * Total of business start-ups during the last 3 or 12 months compared with the same months a year earlier
- Source: INSEE (Sirene)
tableautab3EN – Number of business set-ups (incl. self-managed micro-enterprises)
| NA | March 2015 | April 2015 | May 2015 | |
|---|---|---|---|---|
| Total | 44,086 | 43,666 | 42,899 | |
| Industry | BE | 2,005 | 2,077 | 2,023 |
| Of which Manufacturing | C | 1,742 | 1,777 | 1,735 |
| Construction | FZ | 5,537 | 5,406 | 5,340 |
| Wholesale and retail trade, Transport, Accommodation and Food and beverage activities | GI | 12,495 | 12,245 | 12,132 |
| Of which Trade | G | 8,301 | 8,155 | 8,236 |
| Of which Transportation and storage | H | 2,028 | 1,719 | 1,351 |
| Of which Accommodation and food service activities | I | 2,341 | 2,359 | 2,330 |
| Information and communication | JZ | 2,204 | 2,201 | 2,101 |
| Financial and insurance activities | KZ | 1,395 | 1,319 | 1,330 |
| Real estate activities | LZ | 1,347 | 1,355 | 1,353 |
| Business support activities | MN | 9,489 | 9,491 | 9,130 |
| Public administration and defence, education, human health and social work activities | OQ | 5,423 | 5,405 | 5,271 |
| Other services activities | RS | 4,192 | 4,166 | 4,218 |
- * Seasonally and working-day adjusted data
- Source : Insee, Sirene
tableautab3bisEN – Fluctuation in the number of business set-ups (incl. self-managed micro-entrepreneurs)
| NA | May 15 / April 15 | Moving total % change** | ||
|---|---|---|---|---|
| sa-wda * | over 3 months | over 12 months | ||
| Total | -1.8 | -5.2 | -1.3 | |
| Industry | BE | -2.6 | -14.6 | -5.4 |
| Of which Manufacturing | C | -2.3 | -17.7 | -4.7 |
| Construction | FZ | -1.2 | -17.0 | -12.3 |
| Wholesale and retail trade, Transport, Accommodation and Food and beverage activities | GI | -0.9 | -2.7 | 0.0 |
| Of which Trade | G | 1.0 | -9.0 | -5.8 |
| Of which Transportation and storage | H | -21.5 | 60.6 | 41.9 |
| Of which Accommodation and food service activities | I | -1.3 | -4.4 | 4.9 |
| Information and communication | JZ | -4.5 | -2.2 | 0.1 |
| Financial and insurance activities | KZ | 0.8 | 16.8 | 11.4 |
| Real estate activities | LZ | -0.1 | -1.6 | -3.0 |
| Business support activities | MN | -3.8 | -3.2 | 1.1 |
| Public administration and defence, education, human health and social work activities | OQ | -2.5 | 3.0 | 6.4 |
| Other services activities | RS | 1.2 | -9.0 | -4.2 |
- * Seasonally and working-day adjusted data
- ** Total of business start-ups during the last 3 or 12 months compared with the same months a year earlier
- Source : Insee, Sirene
Pour en savoir plus
Time series : Business demography
