


 23 April 2015
2015- n° 93In the first quarter 2015, production capacity are moderately drawn tight in the manufacturing
industry Quarterly business survey (goods-producing industries) - April 2015
23 April 2015
2015- n° 93In the first quarter 2015, production capacity are moderately drawn tight in the manufacturing
industry Quarterly business survey (goods-producing industries) - April 2015
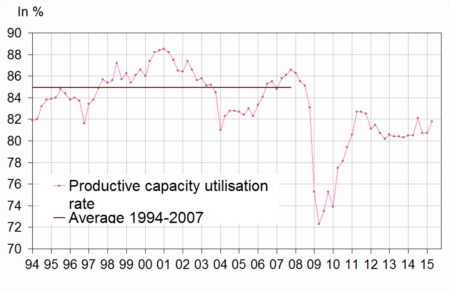
In April 2015, the industrialists have announced more tight production capacity. The productive capacity utilization rate (TUC) has increased by almost one point compared to the previous quarter and reaches 81.8%. Since the third quarter 2008, production capacities are less used in the manufacturing industry than there were on average between 1994 and 2007. The balance on production bottlenecks is stable, at a lever slightly superior to its long-term average.
Slight increase of the tensions on production capacity
In April 2015, the industrialists have announced more tight production capacity. The productive capacity utilization rate (TUC) has increased by almost one point compared to the previous quarter and reaches 81.8%. Since the third quarter 2008, production capacities are less used in the manufacturing industry than there were on average between 1994 and 2007. The balance on production bottlenecks is stable, at a lever slightly superior to its long-term average.
graphiqueGraphang2 – Change in the productive capacity utilisation rate
Improvement of the global demand
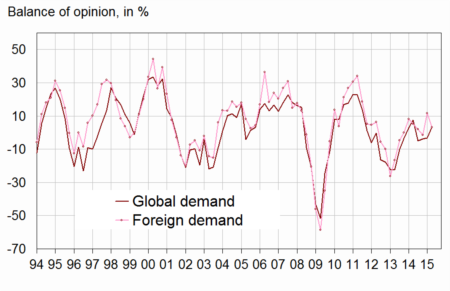
In the survey of April 2015, the balance of opinion on past global demand in the manufacturing industry has improved. Conversely, the balance of opinion on foreign demand has diminished and reached a level close to long-term average. Over the next three months, the industrialists have anticipated a stabilization of the global demand and an improvement of the foreign one above the long-term average. In April, less industrialists have signaled difficulties of demand only (40%) than in January (44%).
graphiqueGraphang1 – Balance of opinion of past change in demand
tableautableau1 – Industrialists' opinion: demand and production factors
| Manufacturing industry | Mean | July 14 | Oct. 14 | Jan. 15 | April 15 |
|---|---|---|---|---|---|
| Global demand | |||||
| Past change | 0 | –5 | –4 | –3 | 3 |
| Future change | 1 | 3 | 4 | 2 | 1 |
| Foreign demand | |||||
| Past change | 3 | 2 | –2 | 12 | 3 |
| Future change | 4 | 9 | 2 | 5 | 10 |
| Production factors | |||||
| Production bottlenecks (in %) | 22 | 23 | 22 | 24 | 24 |
| Assessment of productive capacity | 14 | 16 | 18 | 14 | 14 |
| Productive capacity utilisation rate (in %) | 84.6 | 82.1 | 80.7 | 80.7 | 81.8 |
| Difficulties of supply and demand | |||||
| Difficulties of supply and demand | 8 | 11 | 11 | 9 | 11 |
| Difficulties of supply | 20 | 16 | 16 | 14 | 12 |
| Difficulties of demand | 44 | 40 | 49 | 44 | 40 |
- * : Long-term average since 1976.
- The results of the last survey are preliminary.
- Source : Quaterly business survey - INSEE
Stabilization of the workforce
According to business managers, the rate of job losses in the industry has stagnated compared to the previous quarter. The balance of opinion stays slightly above its long-term average. Over the next few months, industrialists consider that workforce will be alter moderately: the corresponding balance of opinion remains above its historical level.
About a quarter of the industrialists has hiring difficulties, a part which is nearly stable and is slightly below its long-term average.
graphiqueGraphang3 – Workforce size in the manufacturing industry
A slight increase in weekly working time
A few more industrials have highlighted an increase of the weekly working time in the first quarter 2015. Industrialists have anticipated a stagnation of this working time over the next few months.
According to the business managers in the manufacturing industry, wages have increased by 0.1%, the lowest evolution since the first quarter 1999.
Selling prices have increased
According to business managers, the selling prices in the manufacturing industry have bounced back in the first quarter 2015 (+1.0% after -1.2%). They forecast a slight decrease in selling prices for the next quarter.
The proportion of industrialists that have experienced cash-flow problems remains stable compare to the previous quarter. The corresponding balance of opinion stands below its normal level.
Enhancement of opinion on competitive position on foreign market outside EU
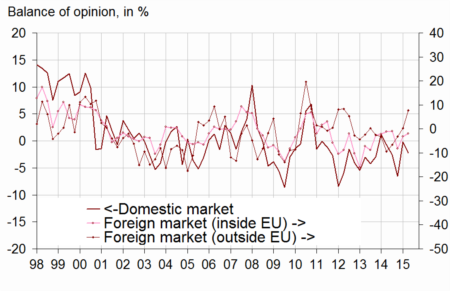
In the survey of April 2015, while business managers judge that their competitive position has decreased on domestic market, it has slightly risen on European market and it has soared on foreign markets outside EU. The corresponding balance of opinion has reached its highest level since April 2011, considerably above its long-term average.
The general exportation expectations have sharply gone up: the corresponding balance increased by 16 points after a rise of 13 points in the previous quarter. It has reached its highest level since October 2000, clearly above it long-term average.
graphiqueGraphang4 – Competitive position
tableautableau2 – Industrialists' opinion: employment, competitive position, cash-flow, wags and selling prices
| Manufacturing industry | Mean | July 14 | Oct. 14 | Jan. 15 | April 15 |
|---|---|---|---|---|---|
| Workforce size | |||||
| Past change | –11 | –6 | –9 | –10 | –10 |
| Expected change | –13 | –8 | –10 | –11 | –9 |
| Difficulties hiring | 28 | 27 | 26 | 27 | 26 |
| Working time | |||||
| Past change | –3 | –1 | –2 | 0 | 2 |
| Expected change | –5 | –3 | –2 | 0 | 0 |
| Cash-flow and wages | |||||
| Cash-flow problems | 15 | 14 | 13 | 12 | 12 |
| Past wages | 0.5 | 0.4 | 0.3 | 0.3 | 0.1 |
| Selling prices | |||||
| Past change | 0.1 | –0.2 | –0.6 | –1.2 | 1.0 |
| Expected change | 0.2 | –0.1 | –0.5 | –1.1 | –0.1 |
| Competitive position | |||||
| On domestic market | 1 | –3 | –7 | 0 | –2 |
| On foreign markets inside EU | –1 | –1 | –8 | –3 | –2 |
| On foreign markets outside EU | –1 | –7 | –3 | 0 | 8 |
| General exportation expectations | –10 | –23 | –15 | –2 | 14 |
- * : Long-term average since 1976.
- The results of the last survey are preliminary.
- A quantitative question is asked about selling prices and past wage.
- Source: Quaterly business survey - INSEE
Documentation
Methodology (pdf,48 Ko)
Pour en savoir plus
Time series : Industry
