


 24 February 2015
2015- n° 40In February 2015, the economic climate remains unfavorable in the building construction
industry Monthly survey of building - February 2015
24 February 2015
2015- n° 40In February 2015, the economic climate remains unfavorable in the building construction
industry Monthly survey of building - February 2015
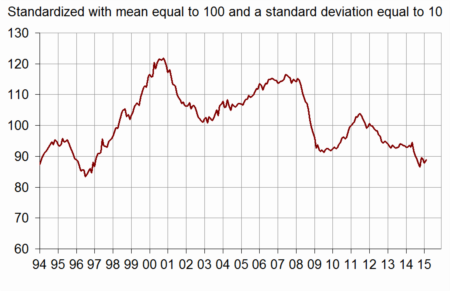
According to the business managers surveyed in February 2015, the business climate remains deteriorated in the building construction industry. The composite indicator has increased by one point (to 89), and stands well below its long-term average (100). The turning point indicator remains in the unfavorable zone.
According to the business managers surveyed in February 2015, the business climate remains deteriorated in the building construction industry. The composite indicator has increased by one point (to 89), and stands well below its long-term average (100). The turning point indicator remains in the unfavorable zone.
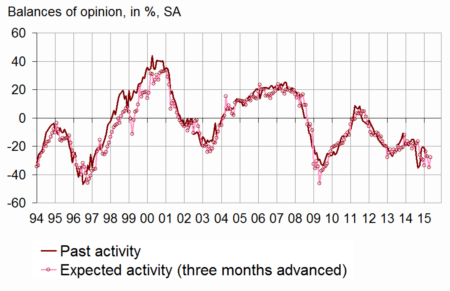
Activity still seen below normal
In February 2015, even more business managers than in January deemed that their activity has deteriorated in the recent period. However, they are slightly less pessimistic about their expected activity for the next few months. The two corresponding balances are clearly below their long-term average.
graphiqueActivity – Activity tendency in the building industry
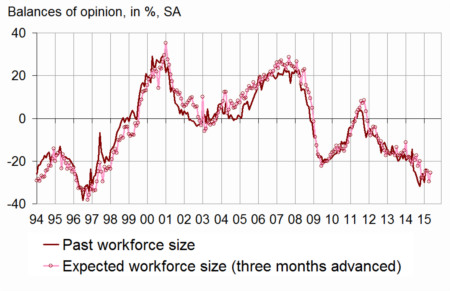
Fewer business manager indicate a fall of their staff size
Fewer business managers than in January have pointed out a fall in past and expected employment. The corresponding balances remain substantially below their long-term average.
graphiqueWorkforce – Workforce size tendency in the building industry
graphiqueClimate – Composite indicator
graphiqueTurningPoint – Turning-point indicator
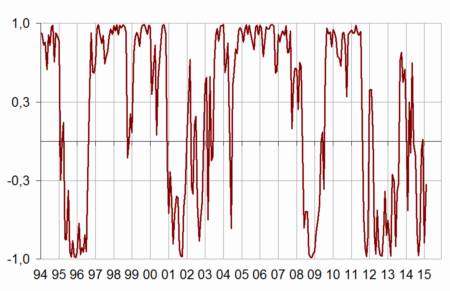
- Lecture: close to 1 (respectively -1), it indicates a favorable climate (respectively unfavorable).
tableauTableau1 – Building industry economic outlook
| Mean* | Nov. 14 | Dec. 14 | Jan. 15 | Feb. 15 | |
|---|---|---|---|---|---|
| Composite indicator | 100 | 89 | 89 | 88 | 89 |
| Past activity | –4 | –22 | –21 | –21 | –28 |
| Expected activity | –6 | –24 | –27 | –35 | –28 |
| Gen. business outlook | –19 | –50 | |||
| Past employment | –4 | –26 | –26 | –30 | –24 |
| Expected employment | –4 | –25 | –25 | –30 | –26 |
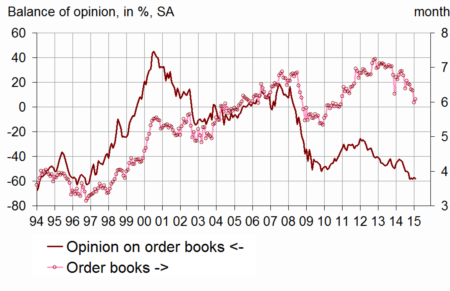
| Opinion on order books | –22 | –58 | –58 | –57 | –58 |
| Order books (in month) | 5,3 | 6,4 | 6,3 | 6,0 | 6,1 |
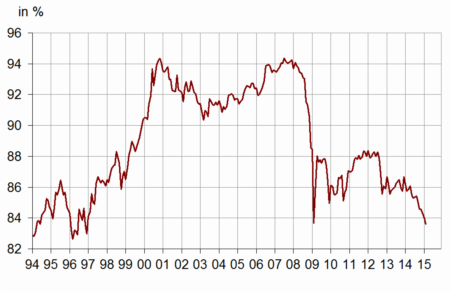
| Productive capacity utilisation rate | 88,7 | 84,6 | 84,2 | 84,0 | 83,6 |
| Obstacles to production increase (in %) | 33 | 21 | 21 | 20 | 20 |
| - Because of workforce shortage (in %) | 14,9 | 3,4 | 3,1 | 2,8 | 3,2 |
| Recruiting problems (in %) | 58 | 38 | |||
| Expected prices | –14 | –36 | –38 | –35 | –37 |
| Cash-flow position | –10 | –27 | |||
| Repayment period | 29 | 49 |
- * Mean since September 1993.
- Source: French business survey in the building industry - INSEE
Order books are considered very low
Business managers have still considered their order books lower than normal. The corresponding balance has fluctuated little around the same low level since October 2014.
graphiqueOrderBooks – Order books
The productive capacity utilization rate at its lowest level since 1996
In February 2015, the productive capacity utilization rate continues to fall and has reached its lowest level (83,6 %) since 1996. At the same time, one business manager out of five has reported difficulties to increase its output, against one out of three in average since 1993.
graphiquePcur – Productive capacity utilization rate
Tight prices
In February, even more business managers than in January indicate price downturns for the next few months. The corresponding balance is substantially below its long-term average.
Documentation
Methodology (2016) (pdf,170 Ko)
Pour en savoir plus
