

 27 February 2015
2015- n° 51In December 2014, the sales volume increased in retail trade Sales volume in the retail trade and personal services - December 2014
27 February 2015
2015- n° 51In December 2014, the sales volume increased in retail trade Sales volume in the retail trade and personal services - December 2014
In December 2014, the sales volume grew in retail trade, except of motor vehicles and motorcycles (+0.4%) and in trade and repair of motor vehicles and motorcycles (+0.6%). While it rebounded in household services (+0.8% after 0.0%), it kept on decreasing in accommodation and food service activities (–0.2% after –1.3%).

Except for indices from Emagsa survey, every index in this issue is in volume (tax excluded) and seasonally and working-day adjusted (SA-WDA). The commentary shows variations of subsections by decreasing contribution. The contribution of a subsection depends on the extent of the change and on its weight.
In December 2014, the sales volume grew in retail trade, except of motor vehicles and motorcycles (+0.4%) and in trade and repair of motor vehicles and motorcycles (+0.6%). While it rebounded in household services (+0.8% after 0.0%), it kept on decreasing in accommodation and food service activities (–0.2% after –1.3%).
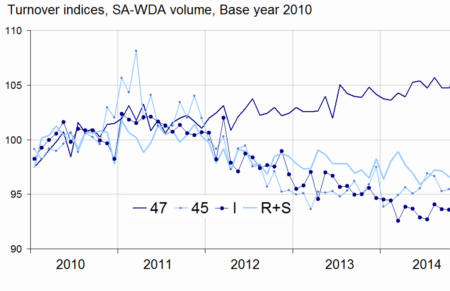
graphiqueGraph1_Anglais – Volume of sales in the retail trade and personal services
Increase in the retail trade except for motor vehicles and motorcycles
In December, the sales volume in retail trade except of motor vehicles and motorcycles went on growing (+0.4% after 1.0% in November). According to early estimates, it is likely to be practically stable in January 2015.
The sales volume improved at nearly the same pace in non specialised stores (+0.5%) and in specialised stores (+0.4%). Among them, the growth in retail sale of automotive fuel (+4.5%) and of other goods (clothings, shoes, etc.) (+0.7%) more than offset the decline in retail sale of other household equipment (–1.3%) and of cultural and recreation goods (–1.9%).
The sales volume in retail trade, except of motor vehicles and motorcycles increased over the last three months (+0.5% q-o-q) and year on year (+1.2%).
tableauTab1_anglais – Variation of sales volume in the retail trade and personal services
| Change in % | |||||
|---|---|---|---|---|---|
| NACE Classification | Weight | Dec./ Nov. | Nov./ Oct. | q-o-q (1) | y-o-y (2) |
| 47 Retail trade, except of motor vehicles and motorcycles | 1000 | 0.4 | 1.0 | 0.5 | 1.2 |
| 471 Retail sale in non-specialized stores | 369 | 0.5 | 0.6 | –0.1 | –1.1 |
| 472 to 477 Retail sale in specialized stores | 573 | 0.4 | 1.2 | 0.8 | 2.7 |
| 478 and 479 Retail trade not in stores | 58 | 0.4 | 2.4 | 0.3 | 1.0 |
| 45 Trade and repair of motor vehicles and motorcycles | 1000 | 0.6 | 0.0 | –0.6 | –0.5 |
| I Accommodation and food service activities | 1000 | –0.2 | –1.3 | –0.8 | –2.5 |
| R+S Household services | 1000 | 0.8 | 0.0 | 0.0 | –0.4 |
| R Arts, entertainment and recreation | 449 | 1.4 | –0.2 | 0.2 | –0.5 |
| S Other service activities | 551 | 0.2 | 0.2 | –0.2 | –0.3 |
- (1) Quarter-on-quarter: last three months / previous three months.
- (2) Year-on-year: last three months / same three months of the previous year.
- The codes correspond to different levels of aggregation of the classification NAF rev.2
- Source: INSEE
tableauTabprecoce_anglais – Variation of sales volume in the retail trade: early estimate*
| Change in % | ||
|---|---|---|
| Jan. 2015/ Dec. 2014 | Jan. 2015/ Jan. 2014 | |
| 47 Retail trade, except of motor vehicles and motorcycles | 0.1 | 2.5 |
- * Econometric estimate from a set of sources available within 30 days after the end of the reference month
- Source: INSEE
Rise in trade and repair of motor vehicles and motorcycles
In December 2014, the sales volume in trade and repair of motor vehicles and motorcycles rose (+0.6%) after a stability in November. It recovered significantly in the sale of motor vehicle parts and accessories (+2.9% after –2.6%) and decreased slightly in the sale of motor vehicles (-0.1%).
The sales volume fell over the last three months (–0.6% q-o-q) and year-on-year (–0.5%).
tableauTab2_anglais – Variation of sales volume in the retail trade and personal services
| Change in % | |||||
|---|---|---|---|---|---|
| Nace Classification | Weight | Dec. 2014 | Dec./ Nov. | Nov./ Oct. | q-o-q (1) |
| 47 Retail trade, except of motor vehicles and motorcycles | 1000 | 106.2 | 0.4 | 1.0 | 0.5 |
| 471 Non-specialised stores | 369 | 99.3 | 0.5 | 0.6 | –0.1 |
| 472 to 477 Specialised stores | 573 | 110.7 | 0.4 | 1.2 | 0.8 |
| 472 Retail sale of food, beverages and tobacco in specialised stores | 49 | 103.2 | 0.2 | 0.3 | 0.4 |
| 473 Retail sale of automotive fuel | 78 | 101.1 | 4.5 | 1.4 | 2.1 |
| 474 Retail sale of information and communication equipment | 28 | 153.5 | –1.1 | –0.4 | 2.7 |
| 475 Retail sale of other household equipment | 112 | 99.3 | –1.3 | 1.1 | –1.1 |
| 476 Retail sale of cultural and recreation goods | 48 | 101.9 | –1.9 | 1.2 | 1.3 |
| 477 Retail sale of other goods in specialised stores | 258 | 117.1 | 0.7 | 1.5 | 1.0 |
| 478 et 479 Retail trade not in stores | 58 | 106.2 | 0.4 | 2.4 | 0.3 |
| 45 Wholesale and retail trade and repair of motor vehicles and motorcycles | 1000 | 96.0 | 0.6 | 0.0 | –0.6 |
| 451 Sale of motor vehicles | 671 | 95.6 | –0.1 | 1.2 | 0.1 |
| 452 Maintenance and repair of motor vehicles | 78 | 89.6 | 0.2 | –1.0 | –1.8 |
| 453 Sale of motor vehicle parts and accessories | 227 | 100.7 | 2.9 | –2.6 | –2.3 |
| 454 Sale, maintenance and repair of motorcycles and related parts and accessories | 24 | 85.7 | –2.5 | –3.6 | 0.3 |
| I Accommodation and food service activities | 1000 | 92.2 | –0.2 | –1.3 | –0.8 |
| 55 Accommodation | 255 | 94.1 | –0.8 | –1.5 | –1.2 |
| 56 Food and beverage service activities | 745 | 91.6 | 0.0 | –1.2 | –0.6 |
| 561 Restaurants… | 549 | 90.3 | –0.3 | –1.3 | –0.4 |
| 562 Event catering… | 116 | 101.2 | 1.3 | –1.3 | –1.6 |
| 563 Beverage serving activities | 80 | 86.4 | –0.7 | –0.2 | –0.5 |
| R+S Household services | 1000 | 97.4 | 0.8 | 0.0 | 0.0 |
| R Arts, entertainment and recreation | 449 | 97.0 | 1.4 | –0.2 | 0.2 |
| 90 Creative, arts and entertainment activities | 115 | 93.4 | –0.2 | 0.9 | –2.1 |
| 91 Libraries, archives, museums… | 11 | 106.9 | 1.3 | 0.6 | –3.8 |
| 92 Gambling and betting activities | 119 | 109.0 | 6.0 | –3.1 | 2.1 |
| 93 Sports activities and amusement... | 204 | 91.6 | –0.6 | 1.1 | 0.6 |
| S Other service activities | 551 | 97.7 | 0.2 | 0.2 | –0.2 |
| 95 Repair of computers… | 228 | 98.6 | 0.7 | 0.3 | 0.8 |
| 96 Other personal service activities | 323 | 97.1 | –0.1 | 0.2 | –1.0 |
- (1) Quarter-on-quarter: last three months / previous three months.
- Source: INSEE
Slight fall in accommodation and food service activities
In December, the sales volume in accommodation and food service activities declined slightly after a strong fall in November (–0.2% after –1.3%). It kept on decreasing in accomodation (–0.8% after –1.5%) and was steady in food and beverage service activities restaurants, where a marked rebound in event catering and other food services (+1.3%) was offset by declines in restaurants and fast food services (–0.3%) and in beverage serving activities (–0.7%).
The sales volume of the whole sector decreased over the last three months (–0.8% q-o-q) and more clearly year on year (–2.5%).
Rise in household services
In December, the sales volume in household services increased (+0.8%) after a stability in November. It rose sharply in gambling and betting activities (+6.0%) and to a lesser extent in repair of computers and personal and household goods (+0.7%). However, it fell in sports activities and amusement (–0.6%).
The sales volume in household services remained stable over the last three months and decreased slightly year-on-year (–0.4%).
Revisions
The change for November was revised by –0.2 point in wholesale and retail trade and repair of motor vehicles and motorcycles and by –0.1 point in household services. Over the same month, it was unchanged in the other sectors.
Monthly survey on large-scale food retailing in January 2015
Turnover in large-scale food retailing decreased in January (–0.6%). Sales of automotive fuel dropped more strongly than December (–7.6% after –1.2%). While sales of food products were slightly down (–0.3% after +0.5%), those of non-food products rebounded sharply (+2.5% after –3.1%).
tableauTab3_anglais – Monthly turnover indices in large-scale food retailing
| Change in % | ||||
|---|---|---|---|---|
| Jan-15/ Déc-14 | Déc./ Nov. | q-o-q (1) | y-o-y (1) | |
| Turnover | –0.6 | 0.2 | –0.5 | –1.1 |
| Including | ||||
| Sales of food products | –0.3 | 0.5 | 0.4 | 0.6 |
| Sales of non-food products | 2.5 | –3.1 | –1.8 | –1.2 |
| Sales of automotive fuel | –7.6 | –1.2 | –7.3 | –9.9 |
- (1) Quarter-on-quarter: last three months / previous three months.
- Source: INSEE - Monthly survey on large scale food retailing (Emagsa)
Documentation
Methodology (pdf,121 Ko)