


 29 May 2015
2015- n° 128In April 2015, household consumption of goods was virtually stable (+0.1%) Household consumption expenditure on goods - April 2015
29 May 2015
2015- n° 128In April 2015, household consumption of goods was virtually stable (+0.1%) Household consumption expenditure on goods - April 2015
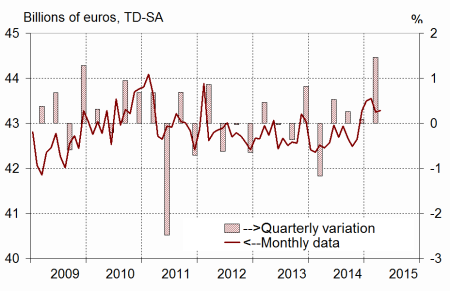
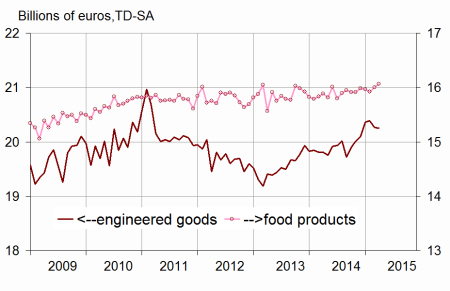
In April 2015, household consumption expenditure on goods was virtually stable: +0.1% in volume*, after –0.7% in March. In detail, consumption of food goods remained dynamic (+0.4% in April after +0.5%), while expenditure on durables stepped back (–0.4% after +1.0%).
In April 2015, household consumption expenditure on goods was virtually stable: +0.1% in volume*, after –0.7% in March. In detail, consumption of food goods remained dynamic (+0.4% in April after +0.5%), while expenditure on durables stepped back (–0.4% after +1.0%).
Engineered goods : stability
Durables: step back in April
Household expenditure on durable goods stepped back in April (–0.4% after +1.0% in March). Expenditure on household durables dropped slightly again (–0.2%, as in March). Car purchases were almost stable (+0.1%), after a sharp increase in March (+1.5%).
Textile-leather: rebound in April
Consumption of textile, clothing and leather recovered in April (+1.3%) after a marked decline in March (–5.1%).
Other engineered goods: decreasing
Consumption expenditure on other engineered goods decreased slightly in April (–0.2%), notably in perfumes, after being stable in March.
[* Volumes are chained and all figures are trading days and seasonally adjusted.]
graphiquegraph1_new_ang – Total consumption of goods
graphiquegraph2_new_ang – Food and engineered goods
graphiquegraph3_new_ang – Breakdown of engineered goods

Food products: increasing again
In April, consumption of food products remained dynamic (+0.4% after +0.5% in March), especially due to meat products consumption.
Energy: decreasing slightly
In April, household consumption of energy products decreased slightly (–0.3%), after a sharp drop in March (–3.3%). A rise of fuel consumption was indeed almost totally offset by a decrease of gas and electricity expenditure.
The variation in March 2015 is scaled down by 0.1 point
Household consumption of goods is scaled down by 0.1 point in March, now estimated at –0.7% instead of –0.6% within the previous publication, due notably to clothing.
This revision arised especially from the fitting of the sub-annual accounts on new annual accounts which were revised with the estimation of the provisional account of the year 2014, from the reestimation of calendar and seasonal adjustment and calibration models, as well as from the integration of new information on the indicators commonly used.
graphiquegraph4_new_ang – Energy

tableautab1_ang – Household consumption expenditure on goods
| Feb. | March | April | April2015/ | |
|---|---|---|---|---|
| 2015 | 2015 | 2015 | April2014 | |
| Food products | 15.925 | 16.001 | 16.062 | |
| Change (%) | -0.3 | 0.5 | 0.4 | 1.1 |
| Engineered goods | 20.387 | 20.261 | 20.257 | |
| Change (%) | 0.1 | -0.6 | 0.0 | 2.3 |
| Durables | 9.995 | 10.099 | 10.055 | |
| Change (%) | 0.1 | 1.0 | -0.4 | 2.3 |
| - of which automobiles | 4.669 | 4.740 | 4.747 | |
| Change (%) | -0.1 | 1.5 | 0.1 | -0.2 |
| - of which household durables | 4.114 | 4.107 | 4.097 | |
| Change (%) | 0.2 | -0.2 | -0.2 | 6.6 |
| Textile-leather | 4.256 | 4.041 | 4.091 | |
| Change (%) | -0.4 | -5.1 | 1.3 | 2.0 |
| Other engineered goods | 6.132 | 6.129 | 6.115 | |
| Change (%) | 0.5 | 0.0 | -0.2 | 2.3 |
| Energy | 7.251 | 7.014 | 6.992 | |
| Change (%) | 1.0 | -3.3 | -0.3 | 3.0 |
| - including petroleum products | 4.399 | 4.262 | 4.328 | |
| Change (%) | 0.2 | -3.1 | 1.6 | 2.8 |
| Total | 43.550 | 43.244 | 43.277 | |
| Change (%) | 0.1 | -0.7 | 0.1 | 2.0 |
| Manufactured goods | 37.174 | 37.059 | 37.187 | |
| Change (%) | 0.0 | -0.3 | 0.3 | 2.0 |
Documentation
Methodology (pdf,23 Ko)
Pour en savoir plus
