


 27 February 2015
2015- n° 54In January 2015, producer prices in industry fell anew (–0.7%) Industrial Producer and Import Price Indices - January 2015
27 February 2015
2015- n° 54In January 2015, producer prices in industry fell anew (–0.7%) Industrial Producer and Import Price Indices - January 2015
Warning: This « Information Rapide » dated 13 March 2015 corrects and replaces this released on 27 February 2015 (No. 45). See also BDM News, March 2015 on insee.fr

Warning: This « Information Rapide » dated 13 March 2015 corrects and replaces this released on 27 February 2015 (No. 45). See also BDM News, March 2015 on insee.fr
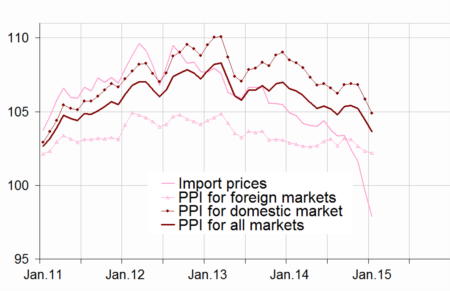
Producer price indices in French industry: –0.7% in January
FRENCH MARKET: –0.9% in January
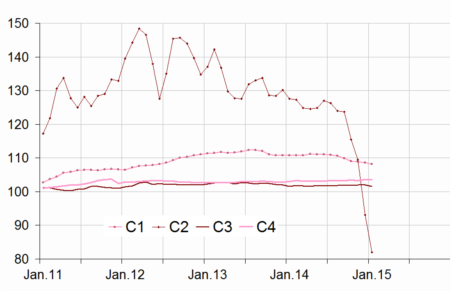
In January, French producer prices in industry for the French market continued to decline (–0.9% in January, as in December), still driven by plummeting prices for petroleum products. Prices for all the main industry sectors also fell, except prices for transport equipment which were almost unchanged in January (+0.1%).
Energy prices moved down again
In January, prices for refined petroleum products continued to tumble (–11.9% after –14.9% in December), driven by diving Brent crude prices. The price fall affected all refined petroleum products and went from –22% for liquified petroleum gas to –2.3% for bulk propane and bottled gas.
In January, gas prices decreased by 1.7%, driven by oil prices. Electricity prices also dropped (–1.1%) due to the decline in prices on the international wholesale electricity market.
Food prices dropped again
The uninterrupted decline in food prices since May 2014 continued in January 2015 (–0.3%). It was mainly due to the fall in prices for meat and meat products (end of the festive season and continuation of lower beef and swine prices), as prices for other food products were stable or increased slightly.
Prices for other manufactured products dipped slightly
In January, prices for other manufactured products dropped slightly (-0.2% after -0.3%) due to lower prices for chemical and pharmaceutical products.
FOREIGN MARKETS: –0.1% in January
Producer prices of French industrial products sold on foreign markets were almost unchanged (–0.1%). The export prices for electrical, electronic, computer equipment and machinery rose by 0.6% due to the stronger dollar and some increases in intra-group prices. Food prices went up 0.4% thanks to the exports to non-euro areas which are billed in dollars.
ALL MARKETS: –0.7% in January
On all markets, prices continued to move down (–0.7% in January after –0.8% in December). Year over year, prices fell significantly (–2.7%), with the collapse in prices for refined petroleum products (–35.7% year-over-year) accounting for at least half of the decline.
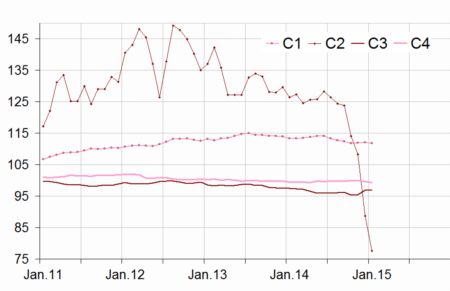
Import price indices of industrial products: –1.6% in January
Import prices fell significantly again (–1.6% in January after –2.0% in December), driven by sinking prices for petroleum products (–12.5% in January). Prices for electrical, electronic, computer equipment and machinery and other manufactured products rose slightly.
graphiqueGraphique1_EN – Total Industry price indices
graphiqueGraphique2_EN – Producer price indices of manufactured products sold on the french market
- Base and reference year:2010
graphiqueGraphique3_EN – Import price indices of manufactured products
tableauTableau1 – French Producer Price Indices in industry according to the market where the products are sold:
| Change in % | ||||
|---|---|---|---|---|
| Levels A 10 and A 17 in CPF rev. 2, 2008 | Weight | Jan.15 | In 1 month | In 1 year |
| French market | ||||
| BE:TOTAL INDUSTRY | 1000 | 104.9 | –0.9 | –3.3 |
| (DE) Mining and quarrying, energy, water | 194 | 113.8 | –0.8 | –0.9 |
| CZ: Manufactured prod. | 806 | 102.3 | –1.0 | –4.0 |
| (C1) Food products, beverages, tobacco | 186 | 108.2 | –0.3 | –2.3 |
| (C2) Coke and refined petroleum products | 56 | 82.0 | –11.9 | –35.7 |
| (C3) Electrical & electronic equip., computers, mach. | 72 | 102.0 | –0.5 | 0.4 |
| (C4) Transport equipment | 111 | 103.6 | 0.1 | 0.6 |
| (C5) Other man. products | 380 | 101.9 | –0.2 | –1.3 |
| Foreign markets | ||||
| BE:TOTAL INDUSTRY | 1000 | 102.2 | –0.1 | –0.6 |
| CZ: Manufactured prod. | 968 | 102.5 | –0.1 | –0.6 |
| (C1) Food products, beverages, tobacco | 122 | 112.0 | 0.4 | –0.2 |
| (C2) Coke and refined petroleum products | 26 | 77.7 | –11.2 | –35.8 |
| (C3) Electrical & electronic equip., computers, mach. | 180 | 99.2 | 0.6 | 1.7 |
| (C4) Transport equipment | 169 | 104.6 | 0.1 | 1.0 |
| (C5) Other man. products | 471 | 101.9 | 0.0 | 0.2 |
| All markets | ||||
| BE:TOTAL INDUSTRY | 1000 | 103.6 | –0.7 | –2.7 |
| CZ: Manufactured prod. | 845 | 101.9 | –0.7 | –3.1 |
| (C1) Food products, beverages, tobacco | 171 | 108.9 | –0.2 | –1.9 |
| (C2) Coke and refined petroleum products | 49 | 80.9 | –11.8 | –35.7 |
| (C3) Electrical & electronic equip., computers, mach. | 98 | 99.8 | 0.0 | 0.9 |
| (C4) Transport equipment | 125 | 104.1 | 0.1 | 0.7 |
| (C5) Other man. products | 402 | 101.8 | –0.2 | –0.9 |
tableauTableau2 – Import prices of industrial products
| Change in % | ||||
|---|---|---|---|---|
| Levels A 10 and A 17 of nomenclature CPF rev. 2, 2008 | Weight | Jan.15 | In 1 month | In 1 year |
| BE:TOTAL INDUSTRY | 1000 | 98.0 | –1.6 | –6.6 |
| CZ: Manufactured prod. | s | 99.7 | –0.6 | –2.9 |
| (C1) Food products, beverages, tobacco | 71 | 111.8 | –0.2 | –1.3 |
| (C2) Coke and refined petroleum products | 53 | 77.7 | –12.5 | –38.5 |
| (C3) Electrical & electronic equip., computers, mach. | 225 | 97.0 | 0.2 | –0.4 |
| (C4) Transport equipment | 147 | 99.3 | –0.4 | –0.2 |
| (C5) Other manufactured products | s | 102.7 | 0.1 | 0.3 |
- r: updated ; nd: non available ; s : confidential
tableauTableau3 – Revision of each index at total industry level
| Oct.14 / Sep.14 | Nov.14 / Oct.14 | Dec.14 / Nov.14 | |
|---|---|---|---|
| French producer prices in industry sold on: | |||
| - the French market | +0.1 | // | // |
| - the foreign markets | // | // | +0.1(1) |
| - all markets | // | // | // |
| Import prices of industrial products | –0.1 | // | –0.1 |
- (1) Reading note: the change of the index between November and December 2014 has been revised by 0,1 point: published in January at –0.4%, it has been updated to –0.3%.
Pour en savoir plus
