


 11 June 2015
2015- n° 139Consumer prices increased by 0.2% in May 2015; and by 0.3% year-on-year Consumer price index - final results - May 2015
11 June 2015
2015- n° 139Consumer prices increased by 0.2% in May 2015; and by 0.3% year-on-year Consumer price index - final results - May 2015
In May 2015, the Consumer Price Index (CPI) increased slightly again (+0.2% after +0.1%). Year-on-year, it rose for the second month in a row (+0.3%, up from +0.1% in April). Seasonally adjusted, it grew by 0.3% month-on-month and year-on-year.
Monthly change: +0.2%; Year-on-year: +0.3%
In May 2015, the Consumer Price Index (CPI) increased slightly again (+0.2% after +0.1%). Year-on-year, it rose for the second month in a row (+0.3%, up from +0.1% in April). Seasonally adjusted, it grew by 0.3% month-on-month and year-on-year.
The rise in consumer prices in May 2015 was mainly due to seasonal increases in prices of food and some services related to tourism with the upcoming summer season. Moreover, prices of petroleum products and some manufactured products have continued to recover.
Moderate rise in service prices
In May 2015, service prices grew slightly again (+0.1% as in April; +1.3% year-on-year). Variations were quite different according to service categories: as every year in May, prices of housing-related services decreased significantly (-0.6% as in May 2014; +1.0% year-on-year) due to seasonally lower rates for collective heating (-27.2%). Furthermore, with the upcoming summer season, prices of tourism-related services rose in May: +0.3% for restaurants and hotels (+1.2% year-on-year), +16.9% for package holidays (-0.4% year-on-year) and +2.9% for holiday rentals (+0.9 % year-on-year). On the opposite, airfares decreased (-2.8% in May; +1.5% year-on-year) after their sharp rebound in April (+8.0%), during the period of spring school holidays.
tableauOLE_LINK2 – Detailed figures for various groups
| Items | Weight | Index | Percentage change | |
|---|---|---|---|---|
| 2015 | May 2015 | m-on-m change | y-on-y change | |
| a) All households - France | ||||
| All items (00 E) | 10000 | 128.57 | 0.2 | 0.3 |
| All items SA (00 C) | 10000 | 128.29 | 0.3 | 0.3 |
| Food (4000 E) | 1662 | 132.97 | 0.5 | 0.4 |
| Fresh food (4001 E) | 211 | 150.9 | 3.2 | 6.4 |
| Food excluding fresh products (4002 E) | 1451 | 130.48 | 0.0 | -0.5 |
| Tobacco (4034 E) | 199 | 259.28 | 0.0 | 0.3 |
| MANUFACTURED PRODUCTS (4003 E) | 2584 | 100.41 | 0.1 | -0.7 |
| Clothing and footwear (4004 E) | 437 | 111.94 | 0.6 | 0.0 |
| Medical products (4005 E) | 427 | 76.19 | -0.5 | -3.1 |
| Other manufactured products (4006 E) | 1720 | 103.94 | 0.2 | -0.2 |
| ENERGY (4007 E) | 815 | 174.33 | 1.0 | -2.4 |
| Petroleum products (4008 E) | 418 | 189.11 | 2.1 | -6.3 |
| SERVICES (4009 E) | 4740 | 137.48 | 0.1 | 1.3 |
| Actual rentals and services for dwellings (4010 E) | 767 | 142.72 | -0.6 | 1.0 |
| Medical services (4011 E) | 568 | 122.98 | 0.1 | 0.6 |
| Transport and communication services (4012 E) | 510 | 97.04 | -0.5 | 1.6 |
| Other services (4013 E) | 2895 | 148.71 | 0.4 | 1.5 |
| ALL ITEMS EXCLUDING RENTALS AND TOBACCO (5000 E) | 9192 | 125.99 | 0.3 | 0.3 |
| ALL ITEMS EXCLUDING TOBACCO (4018 E) | 9801 | 126.65 | 0.2 | 0.3 |
| b) Manual or clerical worker headed urban households - France | ||||
| ALL ITEMS EXCLUDING TOBACCO (4018 D) | 9714 | 126.43 | 0.2 | 0.3 |
| ALL ITEMS (00 D) | 10000 | 129.24 | 0.2 | 0.3 |
| c) Households that belong to the lowest equivalized disposable income quintile - France | ||||
| ALL ITEMS EXCLUDING TOBACCO (4018 Q) | 9687 | 127.70 | 0.2 | 0.3 |
- Source: INSEE - Consumer Price Indexes
tableauTableau1English – Detailed figures for Core inflation* and HICP**
| Items | Weight | Index | Percentage change | |
|---|---|---|---|---|
| 2015 | May 2015 | m-on-m change | y-on-y change | |
| All items "Core inflation" (4022 S) | 6042 | 123.15 | 0.2 | 0.6 |
| Food excluding fresh products, meat, milk and exotic products (4019 S) | 715 | 124.69 | 0.0 | -0.4 |
| Manufactured products (4020 S) | 2103 | 104.6 | 0.3 | -0.2 |
| Services including actual rentals and services for dwellings (4021 S) | 3224 | 140.97 | 0.1 | 1.3 |
| All items HICP (00 H) | 116.32 | 0.2 | 0.3 | |
- * ISJ: Core inflation indicator excludes public sector prices, the most volatile consumer prices and the tax measures. Seasonally adjusted, this index is calculated for all households in France excluding overseas departments and territories (base 100 - 1998).
- **HICP: Harmonised Indices of Consumer Prices are inflation figures designed for international comparison of consumer price inflation between Member states of the European Union. This index is calculated for all households in France (base 100 - 2005).
- Source: INSEE - Consumer Price Indexes
graphiqueGraphique1English – Consumer price index (IPC) and Core inflation (ISJ) – year-on-year changes
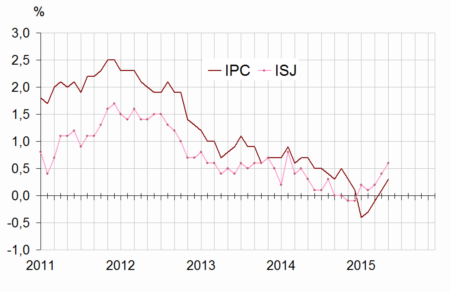
- Source : Insee - Consumer Price Indexes
Renewed rise in energy prices
In May 2015, energy prices increased (+1.0%; -2.4% year-on-year). Prices of petroleum product continued to recover (+2.1% in May; -6.3% year-on-year) in the wake of the crude oil price which have bounced back since February 2015. Motor fuels rose significantly (+2.0%; -5.4% year-on-year) and even more those of heating fuels (+3.4%; -11.3% year-on-year). On the contrary, town gas prices declined in May (-1.1% after +0.5%; -1.8% year-on-year), while electricity prices were stable (+4.3% year-on-year).
Slight increase in prices of manufactured products
Prices of manufactured products increased slightly in May 2015 (+0.1% as in April) but remained on a downward trend year-on-year (-0.7%). Prices of clothing and footwear grew at the same pace than in April (+0.6%; stable year-on-year after -0.5% in April). Prices of other manufactured products continued to strengthen, particularly those of furniture and furnishings (+1.1% after +0.1% in April; +0.5% year-on-year) and household textiles (+1.0% after +1.2% in April; +1.8% year-on-year). Moreover, prices of plants and flowers grew seasonally (1.4%). These increases were partly offset by the continued decline in health product prices (-0.5%; -3.1% year-on-year) and by new decreases in prices of audio-visual, photographic and information processing equipments, even if they were more moderate than during the last few months (-4.6% year-on-year after -5.1% in April and -7.2% in May 2014).
Seasonal rebound in fresh fruit prices
In May 2015, food prices bounced back (+0.5 %) after a stability in April. This increase was mainly due to the seasonal rebound of fresh foodstuff prices (+3.2%; +6.4% year-on-year), especially prices of fresh fruits (+10.5%; +6.6% year-on-year). However, prices of fresh vegetables (-1.8%; +8.2% year-on-year) and of fresh fish and seafood (-2.0%; +1.6% year-on-year) declined. Excluding fresh products, food prices remained overall stable, as in April. Year-on-year, food prices increased by 0.4%. Excluding fresh foodstuffs, they were down 0.5%, only prices of meat, coffee, processed fruits and wines were up year-on-year.
Core inflation rose in May
In May 2015, the core inflation indicator (ISJ) grew by 0.2% (after +0.1% in March and April) and by 0.6% year-on-year (after +0.4% in April). The Harmonized Index of Consumer Prices (HICP) was up 0.2% over a month and by 0.3% year-on-year (after +0.1% month-on-month and year-on-year in April).
Pour en savoir plus
