


 23 December 2014
2014- n° 297Household consumption of goods bounced back in November 2014 (+0.4% after -0.8%) Household consumption expenditure on goods - November 2014
23 December 2014
2014- n° 297Household consumption of goods bounced back in November 2014 (+0.4% after -0.8%) Household consumption expenditure on goods - November 2014
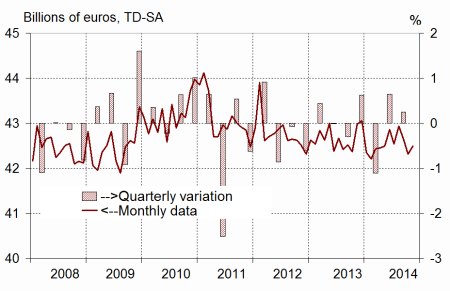
In November 2014, household expenditure on goods increased by 0.4% in volume*, after a decrease of 0.8% in October. This rise was mainly due to purchases of textile, clothing and leather (+2.4% after +3.0% in October) and expenditure on energy products (+0.8% after –6.0% in October), purchases of manufactured goods were almost stable (+0.1% after +0.2%).
In November 2014, household expenditure on goods increased by 0.4% in volume*, after a decrease of 0.8% in October. This rise was mainly due to purchases of textile, clothing and leather (+2.4% after +3.0% in October) and expenditure on energy products (+0.8% after –6.0% in October), purchases of manufactured goods were almost stable (+0.1% after +0.2%).
Engineered goods : increasing
Durables: almost stable
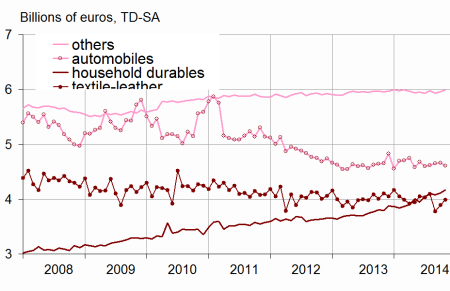
In November, household expenditure on durable goods decelerated (+0.1% after +0.4%). Car purchases slipped (–1.2% after +0.3% in October) and expenditure on household durables accelerated (+1.4% after +0.9%).
Textile-leather: growing again
In November, purchases of textile, clothing and leather rose for the second month in a row (+2.4% after +3.0%). In September, they had reached their lowest level since October 2001.
Other engineered goods: accelerating slightly
Consumption expenditure on other engineered goods accelerated slightly in November (+0.6% after +0.4% in October). This result originated mainly from consumption of hardware.
[* Volumes are chained and all figures are trading days and seasonally adjusted.]
graphiquegraph1_new_ang – Total consumption of goods
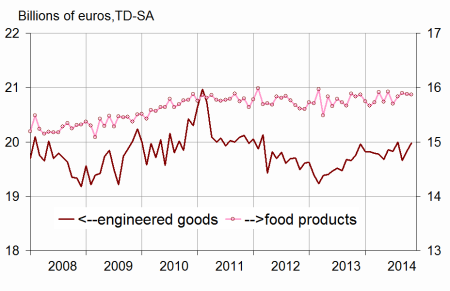
graphiquegraph2_new_ang – Food and engineered goods
graphiquegraph3_new_ang – Breakdown of engineered goods
Food products: almost stable
In November, consumption of food products was overall stable (–0.1%). Expenditure on tobacco products dipped.
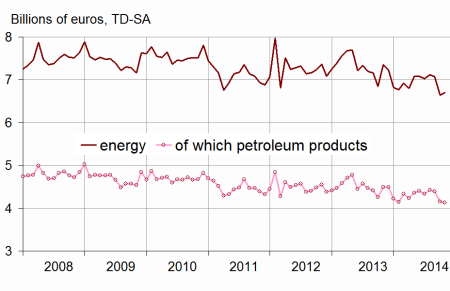
Energy: modest recovery
After a fall in October (–6.0%), household consumption of energy products recovered in November (+0.8%). This upswing resulted mainly from a rise in gas and electricity consumption. Indeed, in spite of mild temperatures once again in November, the seasonal average deviation ended up being lower than in October, so that heating needs increased compared to October. Conversely, fuel expenditure decreased in November. Over the year, total expenditure on energy products dropped by 8.9%.
The change in October is scaled up by 0.1 points
Household consumption of goods in October 2014 is scaled upward by 0.1 points (–0.8% against –0.9% within the previous publication).
This revision is due to the integration of new information on indicators used, especially on housing durables, as well as the updating of the seasonal adjustment coefficients.
graphiquegraph4_new_ang – Energy
tableautab1_eng – Household consumption expenditure on goods
| Sept. | Oct. | Nov. | Nov.2014/ | |
|---|---|---|---|---|
| 2014 | 2014 | 2014 | Nov.2013 | |
| Food products | 15.898 | 15.878 | 15.867 | |
| change (%) | 0.4 | –0.1 | –0.1 | 0.2 |
| Engineered goods | 19.658 | 19.835 | 19.974 | |
| change (%) | –1.7 | 0.9 | 0.7 | 1.1 |
| Durables | 9.958 | 9.994 | 10.002 | |
| change (%) | 0.3 | 0.4 | 0.1 | 3.2 |
| - of which automobiles | 4.648 | 4.661 | 4.606 | |
| change (%) | 0.7 | 0.3 | –1.2 | –1.1 |
| - of which household durables | 4.075 | 4.111 | 4.169 | |
| change (%) | –0.8 | 0.9 | 1.4 | 9.8 |
| Textile-leather | 3.781 | 3.894 | 3.989 | |
| change (%) | –7.7 | 3.0 | 2.4 | –2.7 |
| Other engineered goods | 5.931 | 5.956 | 5.989 | |
| change (%) | –0.7 | 0.4 | 0.6 | 0.5 |
| Energy | 7.075 | 6.648 | 6.703 | |
| change (%) | –0.6 | –6.0 | 0.8 | –8.9 |
| - including petroleum products | 4.389 | 4.155 | 4.130 | |
| change (%) | –0.9 | –5.3 | –0.6 | –8.1 |
| Total | 42.638 | 42.311 | 42.493 | |
| change (%) | –0.7 | –0.8 | 0.4 | –1.1 |
| Manufactured goods | 36.531 | 36.595 | 36.626 | |
| change (%) | –0.6 | 0.2 | 0.1 | 0.2 |
Documentation
Methodology (pdf,23 Ko)
Pour en savoir plus
