


 11 June 2015
2015- n° 138Employment stabilized in Q1 2015 Payroll employment - 1st Quarter 2015
11 June 2015
2015- n° 138Employment stabilized in Q1 2015 Payroll employment - 1st Quarter 2015
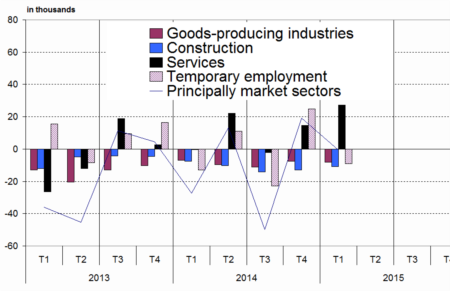
In Q1 2015, payroll employment in non-farm market sectors remained virtually stable (-700 jobs) after an increase in the previous quarter (+0.1%, 19,200 jobs). Excluding temporary work, employment slightly expanded in Q1 2015 (+8,200 jobs after -5,700 jobs in Q4 2014). Year-on-year, principally market sectors lost 18,400 jobs (-0,1%).
In Q1 2015, payroll employment in non-farm market sectors remained virtually stable (-700 jobs) after an increase in the previous quarter (+0.1%, 19,200 jobs). Excluding temporary work, employment slightly expanded in Q1 2015 (+8,200 jobs after -5,700 jobs in Q4 2014). Year-on-year, principally market sectors lost 18,400 jobs (-0,1%).
Employment have continued to fall in industry and construction
Employment in industry continued to shrink in Q1 2015, at the same pace as in Q4 2014 (-8,100 jobs; 0.3%). Year-on-year, 36,400 jobs (-1.1%) were lost in this sector.
Employment in construction also fell again (-10,900 jobs; -0.8%). Year-on-year, this sector lost 48,300 jobs (-3,5%).
Employment rose in services
Temporary employment dropped in Q1 2015: -1.6% (–8,900 jobs), after +4.8 % in Q4 2014 (24,800 jobs).
During this period, employment in services excluding temporary work accelerated (27,700 jobs, i.e.+0.3%, after +14,700 jobs in Q4 2014.
Overall, employment in market services sector continued to increase (+18,300 jobs, i.e. 0.2%, after +39,500 jobs in Q4 2014).
Year-on-year, temporary employment rose slightly (+4,200 jobs, i.e. +0,8%) et market services sector as a whole created 66,300 jobs (+0.6%).
tableautableau_1 – Payroll employment change in the competitive sector : thousands …
| Change in 3 months | Change in 1 year | Level | ||
|---|---|---|---|---|
| 2014 | 2015 | 2015 | 2015 | |
| Q4 | Q1 | Q1 | Q1 | |
| Principally market sectors | 19,2 | –0,7 | –18,4 | 15839,8 |
| Goods-producing industries excl. Construction | –7,5 | –8,1 | –36,4 | 3136,4 |
| Manufacturing | –9,7 | –7,4 | –39,2 | 2766,9 |
| Construction | –12,9 | –10,9 | –48,3 | 1341,1 |
| Services | 39,5 | 18,3 | 66,3 | 11362,2 |
| of which : Temporary employment | 24,8 | –8,9 | 4,2 | 531,0 |
| Principally non-market sectors (*) | 7,2 | 5,4 | 22,5 | 1997,7 |
| Total competitive sector (*) | 26,4 | 4,7 | 4,1 | 17837,6 |
tableautableau_2 – ... Percentage
| Change in 3 months | Change in 1 year | ||
|---|---|---|---|
| 2014 | 2015 | 2015 | |
| Q4 | Q1 | Q1 | |
| Principally market sectors | 0,1 | 0,0 | –0,1 |
| Goods-producing industries excl. Construction | –0,2 | –0,3 | –1,1 |
| Manufacturing | –0,3 | –0,3 | –1,4 |
| Construction | –0,9 | –0,8 | –3,5 |
| Services | 0,3 | 0,2 | 0,6 |
| of which : Temporary employment | 4,8 | –1,6 | 0,8 |
| Principally non-market sectors (*) | 0,4 | 0,3 | 1,1 |
| Total competitive sector (*) | 0,1 | 0,0 | 0,0 |
graphiqueGraph2 – Evolution of principally market sectors
Revisions
Payroll employment estimation of the fourth quarter 2014 on principally market sectors is revised upwards by 20,500 jobs, the estimation of the first quarter 2015 is revised upwards by 12,800 jobs compared to the previous Flash estimation released on 13 May 2015.
tableau – Payroll employment change in the competitive sector (*)
| Code | Change in 3 months | Change in 1 year | Level | ||
|---|---|---|---|---|---|
| Naf | 2014 | 2015 | 2015 | 2015 | |
| rev.2 | Q4 | Q1 | Q1 | Q1 | |
| DE | Electricity, gas, steam, and air conditioning supply ; water supply, sewerage, waste management and remediation activities | 2,2 | –0,7 | 2,8 | 369,6 |
| C1 | Manufacture of food products beverage and tobacco products | 1,3 | 2,1 | 3,7 | 548,1 |
| C2 | Manufacture of coke, and refined petroleum products | 0,0 | 0,0 | –0,1 | 9,7 |
| C3 | Manufacture of computer, electronic and electrical products; manufacture of machinery and equipment | –2,1 | –2,0 | –9,0 | 430,0 |
| C4 | Manufacture of transport equipment | –2,0 | –1,4 | –8,4 | 346,9 |
| C5 | Other manufacturing | –6,9 | –6,0 | –25,4 | 1432,2 |
| FZ | Construction | –12,9 | –10,9 | –48,3 | 1341,1 |
| GZ | Wholesale and retail trade ; repair of motor vehicles and motorcycles | 0,5 | 4,4 | 3,2 | 3002,3 |
| HZ | Transportation and storage | –0,2 | –0,1 | –2,8 | 1335,8 |
| IZ | Accommodation and food service activities | 2,8 | 7,5 | 16,3 | 989,4 |
| JZ | Information and communication | 1,9 | –1,5 | 3,1 | 709,5 |
| KZ | Financial and insurance activities | 1,5 | 3,1 | 7,5 | 848,2 |
| LZ | Real estate activities | 0,2 | 0,9 | 1,1 | 232,1 |
| MN | Professional, scientific and technical activities; administrative and support service activities | 31,7 | 3,0 | 32,1 | 2965,2 |
| of which : Temporary employment | 24,8 | –8,9 | 4,2 | 531,0 | |
| OQ | Public administration and defence ; compulsory social security; education; human health and social work activities | 7,2 | 5,4 | 22,5 | 1997,7 |
| RU | Other service activities | 1,2 | 1,0 | 5,9 | 1279,8 |
- (*) Excl. Agriculture and public employees in non-markets sectors (administration, health, education and social activity)
- Source: INSEE
Documentation
Methodology (pdf,135 Ko)
Pour en savoir plus
