


 28 November 2014
2014- n° 271In October 2014, household consumption of goods decreased again (-0.9% after -0.5%) Household consumption expenditure on goods - October 2014
28 November 2014
2014- n° 271In October 2014, household consumption of goods decreased again (-0.9% after -0.5%) Household consumption expenditure on goods - October 2014
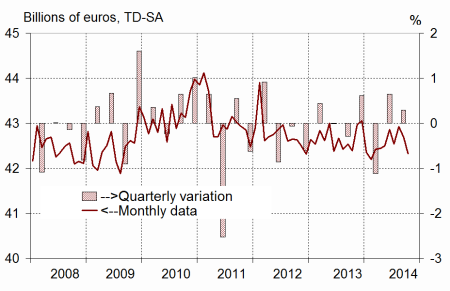
In October 2014, household expenditure on goods dropped by 0.9% in volume*, after a decrease of 0.5% in September. This decline was due to a drop in expenditure on energy products (–6.0% after –0.5%), in reason of higher temperatures than seasonal norms. Purchases of manufactured goods were almost stable (+0.1 % after -0.5 %).
In October 2014, household expenditure on goods dropped by 0.9% in volume*, after a decrease of 0.5% in September. This decline was due to a drop in expenditure on energy products (–6.0% after –0.5%), in reason of higher temperatures than seasonal norms. Purchases of manufactured goods were almost stable (+0.1 % after -0.5 %).
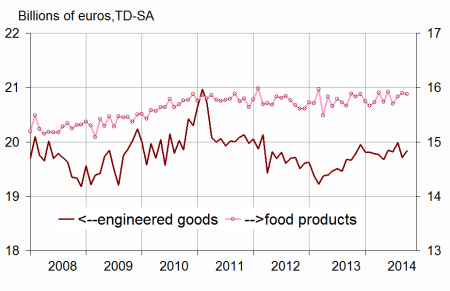
Engineered goods : increasing
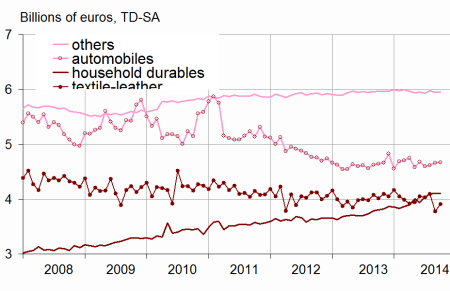
Durables: stability
After a rise in September (+0.8%), household expenditure on durable goods was stable in October. Car purchases increased slightly (+0.2% after +1.0% in September), as did the spending on housing equipment (+0.1% after +0.2%).
Textile-leather: recovery
Purchases in textile, clothing and leather bounced back in October (+3.4%), after a fall in September (–7.7%) which brought them to their lowest level since October 2001.
Other engineered goods: stability
Consumption expenditure on other engineered goods was stable in October after a 0.5% decrease in September. This was mainly due to hardware consumption.
[* Volumes are chained and all figures are trading days and seasonally adjusted.]
graphiquegraph1_new_ang – Total consumption of goods
graphiquegraph2_new_ang – Food and engineered goods
graphiquegraph3_new_ang – Breakdown of engineered goods
Food products: almost stable
In October, consumption of food products was almost stable (–0.1% after +0.4% in September).
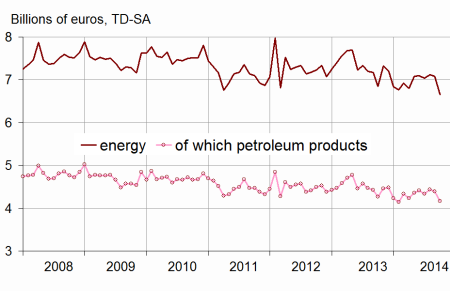
Energy: sharp decline
After a slight decrease in September (–0.5%), household consumption of energy products dropped sharply in October (–6.0%), and reached its lowest level since November 1997. This drop was especially due to very low spending in heating, as temperatures were clearly above seasonal norms in October. Moreover, fuel expenditure decreased as well.
The change in September is scaled up by 0.3 points
Household consumption of goods in September is scaled upward by 0.3 points (–0.5% against –0.8% within the previous publication).
This revision is mainly due to the integration of new information, mainly in telecomunications equipment, as well as the updating of the seasonal adjustment coefficients.
graphiquegraph4_new_ang – Energy
tableautab1_eng – Household consumption expenditure on goods
| Aug. | Sept. | October | Oct.2014/ | |
|---|---|---|---|---|
| 2014 | 2014 | 2014 | Oct.2013 | |
| Food products | 15.830 | 15.899 | 15.878 | |
| Change (%) | 0.8 | 0.4 | –0.1 | –0.1 |
| Engineered goods | 19.983 | 19.707 | 19.839 | |
| change (%) | 0.8 | –1.4 | 0.7 | 0.9 |
| Durables | 9.913 | 9.995 | 9.993 | |
| change (%) | 0.6 | 0.8 | 0.0 | 3.1 |
| -Of which automobiles | 4.613 | 4.659 | 4.667 | |
| Change (%) | 0.3 | 1.0 | 0.2 | 0.5 |
| -Of which household durables | 4.095 | 4.104 | 4.106 | |
| Change (%) | 1.5 | 0.2 | 0.1 | 7.9 |
| Textile-leather | 4.096 | 3.779 | 3.906 | |
| Change (%) | 1.6 | –7.7 | 3.4 | –2.6 |
| Other engineered goods | 5.974 | 5.946 | 5.949 | |
| Change (%) | 0.8 | –0.5 | 0.0 | 0.2 |
| Energy | 7.121 | 7.082 | 6.658 | |
| Change (%) | 1.2 | –0.5 | –6.0 | –2.8 |
| -including petroeum products | 4.431 | 4.395 | 4.165 | |
| Change (%) | 2.2 | –0.8 | –5.2 | –2.3 |
| Total | 42.929 | 42.693 | 42.326 | |
| Change (%) | 0.9 | –0.5 | –0.9 | –0.2 |
| Manufactured goods | 36.757 | 36.586 | 36.608 | |
| Change (%) | 1.1 | –0.5 | 0.1 | 0.4 |
Documentation
Methodology (pdf,23 Ko)
Pour en savoir plus
