


 15 October 2014
2014- n° 237Decrease in business start-ups in September 2014 Enterprise births - September 2014
15 October 2014
2014- n° 237Decrease in business start-ups in September 2014 Enterprise births - September 2014
In September 2014, the number of business start-ups including self-managed enterprises seasonally and working-day adjusted (sa-wda) moved back compared to August by -0.8% for all business start-ups and by –3.1% excluding self-managed enterprises (auto–entreprises).
In September 2014, the number of business start-ups including self-managed enterprises seasonally and working-day adjusted (sa-wda) moved back compared to August by -0.8% for all business start-ups and by –3.1% excluding self-managed enterprises (auto–entreprises).
+4.9% year-on-year (quarterly basis)
The amount of births added up in the last three months increased compared to the same months one year before (+4.9%) for all entreprises, as well as for companies alone (+5.0%).
The sectors that most contributed to that growth were business support activities; education, health and social work activities.
+2.3% year-on-year (twelve months basis)
During the last twelve months, the number of business start-ups rose by 2.3% year-on-year, especially for companies (+4.3%).
More than half of business set-ups are self–managed enterprises
In September 2014, 51.2% of business set-ups over the last twelve months were self-managed enterprises.
tableautab0EN – Business set-ups distribution by type %
| July 2014 | Aug. 2014 | Sept. 2014 | |
|---|---|---|---|
| Companies | 29.9 | 29.9 | 29.9 |
| Sole proprietorships | 19.2 | 19.0 | 18.8 |
| Self-managed business | 50.9 | 51.0 | 51.2 |
- Source: INSEE (Sirene)
tableautab1EN – Business set-ups by month (sa-wda *)
| June 2014 | July 2014 | Aug. 2014 | Sept. 2014 | |
|---|---|---|---|---|
| Excl. self-managed enterprises | 22,321 | 22,586 | 22,457 | 21,759 |
| Variation [m-o-m] % | -1.1 | 1.2 | -0.6 | -3.1 |
| Incl., self-managed enterprises | 45,282 | 46,687 | 46,416 | 46,045 |
| Variation [m-o-m] % | -0.5 | 3.1 | -0.6 | -0.8 |
- * Seasonally and working-day adjusted data
- Source: INSEE (Sirene)
tableautab2EN – Business start-ups by type
| Moving total % change* | Moving total | Moving total | ||
|---|---|---|---|---|
| over 3 months | over 12 months | January- September 2014 | January- September 2013 | |
| Total | 4.9 | 2.3 | 413,032 | 402,950 |
| Companies | 5.0 | 4.3 | 122,869 | 117,555 |
| Sole proprietorships | 4.9 | 1.4 | 290,163 | 285,395 |
| Of which self-managed | 8.6 | 0.4 | 212,444 | 206,504 |
- * Total of business start-ups during the last 3 or 12 months compared with the same months a year earlier
- Source: INSEE (Sirene)
graphiqueGraph1EN – Business start-ups (sa-wda *)
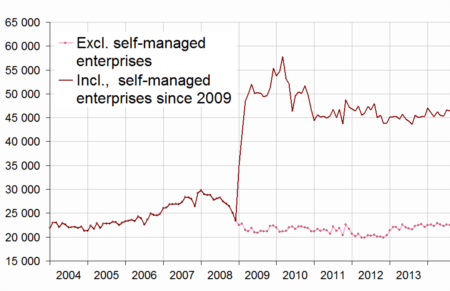
- * Seasonally and working-day adjusted data
- Source: INSEE (Sirene)
Pour en savoir plus
Time series : Business demography
