


 26 August 2014
2014- n° 189Increase in business start-ups in July 2014 Enterprise births - July 2014
26 August 2014
2014- n° 189Increase in business start-ups in July 2014 Enterprise births - July 2014
In July 2014, the number of business start-ups including self-managed enterprises seasonally and working-day adjusted data (sa-wda) went up compared to June: +.3.5% for all business starts-up and +1.8% excluding self-managed enterprises.
In July 2014, the number of business start-ups including self-managed enterprises seasonally and working-day adjusted data (sa-wda) went up compared to June: +.3.5% for all business starts-up and +1.8% excluding self-managed enterprises.
+1.5% year-on-year (quarterly basis)
The amount of entries added up in the last three months increased compared to the same months one year before (+1.5%), specially for companies (+3.1%).
The sectors that most contributed to that growth were business support activities; education, health and social work activities and also accommodation, food and be-verage service activities.
+1.1% year-on-year (twelve months basis)
During the last twelve months, the number of business start-ups rose by 1.1% year-on-year, especially the number of companies increased (+3.1%).
More than half of the creations are self-managed enterprises
In July 2014, 50.9% of business set-ups over the last twelve months were self-managed enterprises.
tableautab0EN – Business set-ups distribution by type %
| May 2014 | June 2014 | July 2014 | |
|---|---|---|---|
| Companies | 29,9 | 30,0 | 29,9 |
| Individual enterprises | 19,3 | 19,2 | 19,2 |
| Self-managed business | 50,8 | 50,8 | 50,9 |
- Source: INSEE (Sirene)
tableautab1EN – Business set-ups by month
| April 2014 | May 2014 | June 2014 | July 2014 | |
|---|---|---|---|---|
| Excl. self-managed enterprises (sa-wda *) | 22 912 | 22 622 | 22 449 | 22 843 |
| Variation [m-o-m] % | 2.6 | -1.3 | -0.8 | 1.8 |
| Incl., self-managed enterprises | 46 172 | 45 443 | 45 403 | 46 990 |
| Variation [m-o-m] % | 2.1 | -1.6 | -0.1 | 3.5 |
- * Seasonally and working-day adjusted data
- Source: INSEE (Sirene)
tableautab2EN – Business start-ups by type
| Moving total % change* | Moving total | Moving total | ||
|---|---|---|---|---|
| over 3 months | over 12 months | January- July 2014 | January- July 2013 | |
| Total | 1.5 | 1.1 | 332 012 | 325 645 |
| Companies | 3.1 | 3.1 | 100 740 | 96 798 |
| Individual enterprises | 0.8 | 0.2 | 231 272 | 228 847 |
| Of which self-managed | 2.3 | -2.8 | 167 635 | 165 202 |
- * Total of business start-ups during the last 3 or 12 months compared with the same months a year earlier
- // = meaningless
- Source: INSEE (Sirene)
graphiqueGraph1EN – Business start-ups
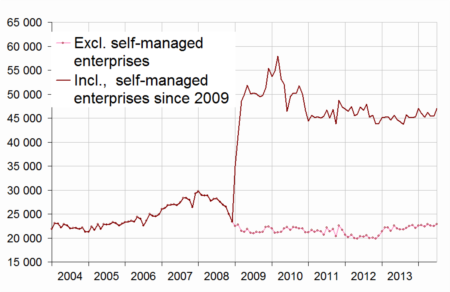
- * Seasonally and working-day adjusted data
- Source: INSEE (Sirene)
Pour en savoir plus
Time series : Business demography
