


 14 November 2014
2014- n° 259In Q3 2014 GDP increased by 0.3% Quarterly national accounts - second estimate - 3rd Quarter 2014
14 November 2014
2014- n° 259In Q3 2014 GDP increased by 0.3% Quarterly national accounts - second estimate - 3rd Quarter 2014
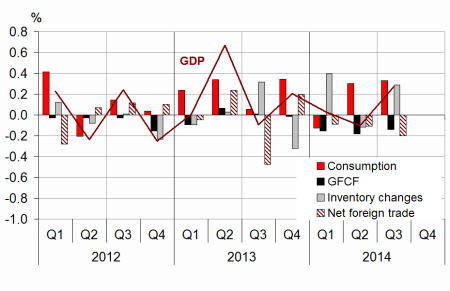
In Q3 2014, GDP in volume terms* increased by 0.3%, after a slight decline in Q2 (–0.1%).
In Q3 2014, GDP in volume terms* increased by 0.3%, after a slight decline in Q2 (–0.1%).
Households’ consumption expenditure kept increasing moderately (+0.2% after +0.3%). General government expenditure increased by 0.8% in the last quarter (after +0.5%). Total gross fixed capital formation (GFCF) went down again (–0.6% after –0.8%). Thus, final domestic demand (excluding inventory changes) was still going up and contributed for +0.2 points to GDP growth (after 0.1 points in Q2). Exports recovered (+0.5% after –0.1%) while imports accelerated (+1.1% after +0.3%). The foreign trade balance contributed negatively to activity (–0.2 points after –0.1 points in previous quarter),while changes in inventories contributed positively to GDP growth (+0.3 points after –0.1 points).
Total production recovered
After an almost stable second quarter (–0.1%), production in goods and services recovered in Q3 (+0.5%). Manufacturing output bounced back (+0.5% after –0.8%) notably due to coke and refined petroleum industry and transport equipment. Production in tradable services slightly sped up in Q3 (+0.5% after +0.1%). On the contrary, output in construction was still falling (–1.0% after –1.4%).
Households’ consumption slightly deccelerated, while general government’s one accelerated.
In Q3 2014, households’ consumption expenditure slightly deccelerated (+0.2% after +0.3%). Heating expenditure kept rising but at a slower rate (+1.2% after +2.2%). Consumption in food products slightly decreased (–0.3% after +0.9%) while the expenditure in manufactured goods picked up moderately (+0.4% after –0.2%): consumption of equipment goods kept increasing significantly (+3.0% after +2.8%) while clothing expenditure declined again (–0.3% after –2.2%); car purchase also slowed down (–0.9% after +0.5%). Besides, expenditure on services moderately increased (+0.2% after +0.1%).

* This growth rate is seasonally and working-day adjusted; volumes are chain-linked previous-year-prices volumes.
graphiqueGraph1 – GDP and its main components
tableauTab1 – Goods and services:supply and uses chain-linked volumes
| 2013 Q4 | 2014 Q1 | 2014 Q2 | 2014 Q3 | 2013 | 2014 (ovhg) | |
|---|---|---|---|---|---|---|
| GDP | 0.2 | 0.0 | -0.1 | 0.3 | 0.4 | 0.4 |
| Imports | 0.4 | 0.7 | 0.3 | 1.1 | 1.9 | 2.8 |
| Household' consumption *expenditure | 0.4 | -0.4 | 0.3 | 0.2 | 0.3 | 0.3 |
| General government's *consumption expenditure | 0.6 | 0.4 | 0.5 | 0.8 | 2.0 | 1.9 |
| GFCF | -0.1 | -0.7 | -0.8 | -0.6 | -0.8 | -1.6 |
| *of which Non financial corporated and unincorporated enterprises | 0.7 | -0.6 | -0.5 | -0.1 | -0.6 | -0.2 |
| Households | -1.8 | -1.9 | -1.9 | -1.7 | -3.1 | -6.0 |
| General government | -0.1 | 0.2 | -0.7 | -1.2 | 1.1 | -0.4 |
| Exports | 1.1 | 0.5 | -0.1 | 0.5 | 2.4 | 1.9 |
| Contributions: | ||||||
| Internal demand excluding inventory changes | 0.3 | -0.3 | 0.1 | 0.2 | 0.4 | 0.3 |
| Inventory changes | -0.3 | 0.4 | -0.1 | 0.3 | -0.2 | 0.4 |
| Net foreign trade | 0.2 | -0.1 | -0.1 | -0.2 | 0.1 | -0.3 |
tableauTab2 – Sectoral accounts
| 2013 Q4 | 2014 Q1 | 2014 Q2 | 2014 Q3 | 2013 | 2014 (ovhg) | |
|---|---|---|---|---|---|---|
| Profit ratio of NFC* (level) | 29.4 | 29.9 | 29.4 | 29.8 | ||
| Household purchasing power | -0.3 | 0.9 | 0.5 | 0.0 | 0.9 |
- *NFC: non-financial corporations
tableauTab3 – Production, Consumption and GFCF: main components
| 2013 Q4 | 2014 Q1 | 2014 Q2 | 2014 Q3 | 2013 | 2014 (ovhg) | |
|---|---|---|---|---|---|---|
| Production of branches | 0.2 | 0.2 | -0.1 | 0.5 | 0.5 | 0.6 |
| Goods | 0.0 | 0.4 | -0.4 | 0.8 | -0.2 | 0.1 |
| Manufacturing Industry | 0.2 | 0.8 | -0.8 | 0.5 | -0.6 | 0.3 |
| Construction | -0.2 | -1.3 | -1.4 | -1.0 | -1.2 | -2.9 |
| Market services | 0.4 | 0.2 | 0.1 | 0.5 | 0.9 | 1.1 |
| Non-market services | 0.4 | 0.4 | 0.3 | 0.5 | 1.5 | 1.5 |
| Household consumption | 0.4 | -0.4 | 0.3 | 0.2 | 0.3 | 0.3 |
| Food products | 0.9 | -1.0 | 0.9 | -0.3 | 0.1 | 0.2 |
| Energy | -1.6 | -3.8 | 2.2 | 1.2 | 0.8 | -4.4 |
| Engineered goods | 1.3 | 0.1 | -0.2 | 0.4 | -1.0 | 1.4 |
| Services | 0.1 | 0.2 | 0.1 | 0.2 | 0.6 | 0.6 |
| GFCF | -0.1 | -0.7 | -0.8 | -0.6 | -0.8 | -1.6 |
| Manufactured goods | 0.6 | -0.1 | -0.5 | -0.2 | -0.9 | 0.4 |
| Construction | -0.6 | -1.4 | -1.7 | -1.4 | -1.6 | -3.9 |
| Market services | 0.3 | 0.0 | 0.2 | 0.2 | 0.3 | 0.5 |
tableauTab4 – Households’ disposable income and ratios of households’ account
| 2013 Q4 | 2014 Q1 | 2014 Q2 | 2014 Q3 | 2013 | 2014 (ovhg) | |
|---|---|---|---|---|---|---|
| HDI | -0.3 | 1.3 | 0.5 | 0.6 | 1.4 | |
| Household purchasing power | -0.3 | 0.9 | 0.5 | 0.0 | 0.9 | |
| HDI by cu* (purchasing power) | -0.5 | 0.8 | 0.3 | -0.6 | 0.4 | |
| Adjusted HDI (purchasing power) | -0.1 | 0.8 | 0.5 | 0.5 | 1.1 | |
| Saving rate (level) | 14.5 | 15.6 | 15.7 | 15.1 | ||
| Financial saving rate (level) | 5.4 | 6.6 | 7.0 | 5.8 |
- *cu: consumption unit
tableauTab5 – Ratios of non-financial corporations’ account
| 2013 Q4 | 2014 Q1 | 2014 Q2 | 2014 Q3 | 2013 | |
|---|---|---|---|---|---|
| Profit share | 29.4 | 29.9 | 29.4 | 29.8 | |
| Investment ratio | 22.7 | 22.5 | 22.5 | 22.6 | |
| Savings ratio | 17.2 | 17.1 | 17.1 | 17.1 | |
| Self-financing ratio | 75.6 | 75.7 | 76.0 | 75.7 |
tableauTab6 – Expenditure, receipts and net borrowing of public administrations
| 2013 Q4 | 2014 Q1 | 2014 Q2 | 2014 Q3 | 2013 | |
|---|---|---|---|---|---|
| In billions of euros | |||||
| Total expenditure | 305.1 | 307.8 | 308.9 | 1207.7 | |
| Total receipts | 284.1 | 286.0 | 285.0 | 1120.4 | |
| Net lending (+) or borrowing (-) | -21.0 | -21.8 | -23.9 | -87.2 | |
| In % of GDP | |||||
| Net lending (+) or borrowing (-) | -4.0 | -4.1 | -4.5 | -4.1 |
General government expenditure accelerated (+0.8% after +0.5%) due to medicines expenditure and health services in particular.
Investment kept declining
After four consecutive quarters of decline, global GFCF shrank again in Q3 2014 (–0.6% after –0.8%). Investment in construction kept falling, but the decline lessened (–1.4% after –1.7%). Expenditure on manufactured goods went down again (–0.2% after –0.5%): the decrease in transport equipment (–1.3% after –0.4%) is partly compensated by the increase in equipment goods (+0.6% after –0.9%). Investment in tradable services increased slowly (+0.2%, as in the previous quarter).
The decline in investment is lower in non-financial corporations (–0.1% after –0.5%) than in general government (–1.2% after –0.7%) and households (–1.7% after –1.9%).
Exports and imports sped up
In Q3 2014, exportations slightly bounced back (+0.5% after –0.1%). Exportations in manufactured goods levelled off (0.0% after –0.6%): while exportations of transport equipment shrank, those of pharmacy and coke and refined petroleum sharply rose.
Importations increased at a steady pace (+1.1% after +0.3%), espacially for transport equipment.
Overall, the foreign trade balance contributed negatively to GDP: –0.2 points in the 3rd quarter (after –0.1 points).
Changes in inventories contributed positively to the activity
Changes in inventories had a positive contribution to GDP growth: +0.3 points after –0.1 points in the 2nd quarter. Transport equipement contributed for +0.5 points to GDP (after a neutral contribution), thus it overcompensated the contribution of the trade balance of these goods.
Revisions
In Q2 the growth rate of GDP is slightly downscaled (from 0.0% to –0.1%) compared to previous release, due to revision in seasonal adjustment (in household consumption of energy, notably). The growth overhang for 2014 has been revised by +0.1 points and it now reaches +0.4%.
Pour en savoir plus
Time series : Operations on goods and services
Time series : Gross domestic product balance
Time series : Institutional sector accounts
Time series : Branch accounts
