


 14 November 2012
2012- n° 277Increase in business setting up in October 2012 Enterprise births - October 2012
14 November 2012
2012- n° 277Increase in business setting up in October 2012 Enterprise births - October 2012
In October 2012, the number of business start-ups increased compared to September: +1% for business setting up excluding self-managed enterprises (seasonally and working-day adjusted data); +10.6% if the number of self-managed enterprises (raw data) is added.
Warning : Only business start-ups data excluding self-managed enterprises (SME) are seasonally adjusted. In February 2012, the seasonal adjustment model has been reviewed. In order to get the total of enterprise births, the raw number of SME is added. The SME time series is too short to be properly deseasonalized.
In October 2012, the number of business start-ups increased compared to September: +1% for business setting up excluding self-managed enterprises (seasonally and working-day adjusted data); +10.6% if the number of self-managed enterprises (raw data) is added.
+3.3% year-on-year (quarterly basis)
The amount of entries added up August, September and October 2012 increased compared to the same months one year before (+3.3%).
The sectors that most contributed to that increase were “education; human health and social work activities” and business support service activities.
+1.7% year-on-year (twelve months basis)
During the last twelve months, the number of business start-ups decreased by 1.7% year-on-year.
265,538 self-managed enterprises since the beginning of 2012
For the first ten months of 2012, more than one out of two business setting up were self-managed enterprises (265,538).
tableautab0EN – Self-managed business setting up
| July 2012 | Aug. 2012 | sept 2012 | Oct. 2012 |
|---|---|---|---|
| 23 859 | 20 763 | 26 410 | 31 111 |
- Source: INSEE (Sirene)
tableautab1EN – Business setting up by month
| July 2012 | Aug. 2012 | sept 2012 | Oct. 2012 | |
|---|---|---|---|---|
| Excl. self-managed enterprises (sa-wda *) | 20 093 | 20 533 | 19 872 | 20 080 |
| Variation [m-o-m] % | -1.1 | 2.2 | -3.2 | 1.0 |
| Incl., in raw data, self-managed enterprises | 43 952 | 41 296 | 46 282 | 51 191 |
| Variation [m-o-m] % | -7.3 | -6.0 | 12.1 | 10.6 |
- * Seasonally and working-day adjusted data
- Source: INSEE (Sirene)
tableautab2EN – business start-ups by type
| Moving total % change* | Moving total | Moving total | ||
|---|---|---|---|---|
| over 3 months | over 12 months | January- October 2012 | January- October 2011 | |
| Total | 3.3 | 1.7 | 470 401 | 458 676 |
| Companies | -3.2 | -1.5 | 134 285 | 137 850 |
| Individual enterprises | 5.9 | 3.0 | 336 116 | 320 826 |
| Of which self-managed | 9.4 | 6.3 | 265 538 | 243 814 |
- * Total of enterprises births during the last 3 or 12 months compared with the same months a year earlier
- // = meaningless
- Source: INSEE (Sirene)
graphiqueGraph1EN – Business start-ups
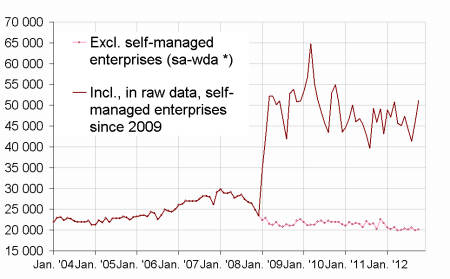
- * Seasonally and working-day adjusted data
- Source: INSEE (Sirene)
Pour en savoir plus
Time series : Business demography
