


 30 November 2011
2011- n° n° nnn Services Producer Price Indices : stability in the third quarter 2011 Services producer price indices - third quarter 2011
30 November 2011
2011- n° n° nnn Services Producer Price Indices : stability in the third quarter 2011 Services producer price indices - third quarter 2011
In the third quarter 2011, B to B services prices were unchanged. Prices of telecommunications services continued to fall (during the 2nd quarter). By contrast, prices of legal activities and landscape services increased again.
- Information and communication
- Continuous decline in telecoms prices, increase in software publishing prices
- Professional, scientific and technical services
- Legal services prices moved up
- Administrative and support services
- Decline in the rental of construction equipments prices, increase in landscape services prices
In the third quarter 2011, B to B services prices were unchanged. Prices of telecommunications services continued to fall (during the 2nd quarter). By contrast, prices of legal activities and landscape services increased again.
Information and communication
Continuous decline in telecoms prices, increase in software publishing prices
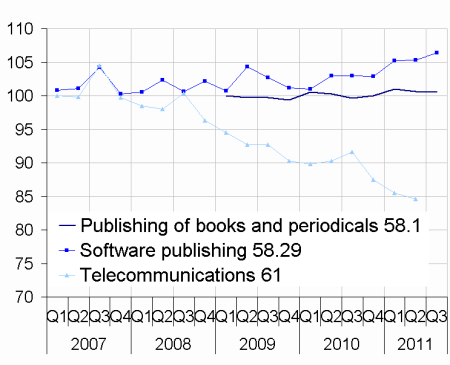
Prices of telecommunications services fell in the third quarter (-1.1 %), and year-over-year (-6.3 %), according to their trend. By contrast, prices of software publishing rose by 1 % in the third quarter (+3.3 % year-over-year), pursuing a trend started in 2010. Prices of other information and communication services were unchanged.
Professional, scientific and technical services
Legal services prices moved up
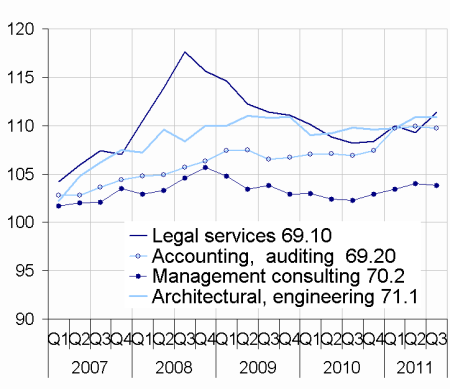
Prices of legal services were the only ones to move significantly (+1.9 % in a quarter, +3 % year-over-year). They had recorded a marked decline between the third quarter 2008 and the third quarter 2010.
Administrative and support services
Decline in the rental of construction equipments prices, increase in landscape services prices
Rental of construction equipment prices fell again in the third quarter 2011 (-0,6%). By contrast, prices of services to buildings and landscape moved up again (+0.9%), most notably those of landscape services (+2%).
Three new series are published (reference 100 for 1st quarter of 2010) :
78 - Employment services
81 - Services to buildings and landscape
81.10 - Combined facilities support services
tableautableau1 – Services Producer Price Indices: French market
| CPA rev. 2 - Base 2005=100 except opposite indication in footnote | Weights | Indices Q3* 2011 | Changes in % | ||
|---|---|---|---|---|---|
| (M €) | Q/ Q-1 | Q/ Q-4 | |||
| 38.1 & 38.2 (1) | Waste collection, treatment and disposal | 21 252 | 100.6 | 0.8 | –1.0 |
| 53.20 | Other postal and courier services | 555 | 100.0 | 0.0 | 0.8 |
| Information and communication | |||||
| 58.1 (1) | Publishing of books and periodicals | 15 313 | 100.5 | –0.1 | 0.9 |
| 58.29 | Software publishing | 6 336 | 106.4 | 1.0 | 3.3 |
| 61 (2) | Telecommunications | 12 650 | 84.6* | –1.1 | –6.3 |
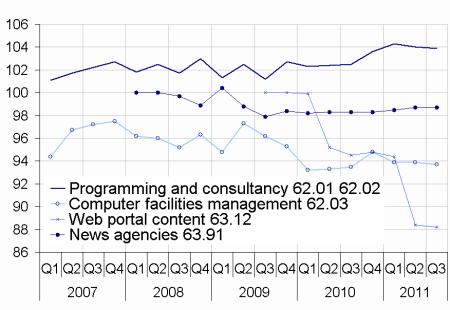
| 62.01 & 62.02 | Computer programming and consultancy | 39 983 | 103.9 | –0.1 | 1.4 |
| 62.03 | Computer facilities management | 5 135 | 93.7 | –0.2 | 0.2 |
| 63.91 (3) | News agencies | 725 | 98.7 | 0.0 | 0.4 |
| Professional, scientific and technical services | |||||
| 69.10 (4) | Legal services | 19 168 | 111.4 | 1.9 | 3.0 |
| 69.20 | Accounting, tax consulting | 13 346 | 109.7 | –0.2 | 2.6 |
| 70.2 | Management consulting | 22 565 | 103.8 | –0.2 | 1.5 |
| 71.1 (5) | Architectural, engineering | 44 420 | 110.9 | 0.0 | 1.0 |
| 71.20 | Technical testing and analysis | 5 461 | 97.7 | 0.0 | 0.2 |
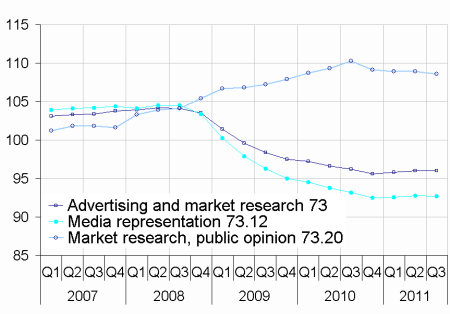
| 73 (4) | Advertising and market research | 19 960 | 96.0 | 0.0 | –0.2 |
| Administrative and support services | |||||
| 77.1 | Rental of motor vehicles | 8 121 | 106.6 | –0.2 | 1.3 |
| 77.32 | Rental of construction equipment | 8 465 | 93.5 | –0.6 | 2.4 |
| 77.39 (6) | Rental of other machinery, | 7 023 | 107.6 | 0.7 | 3.0 |
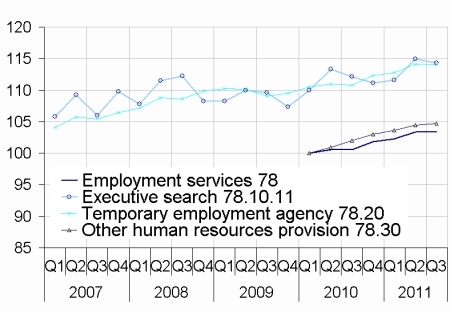
| 78 (6) | Employment services | 28 623 | 103.4 | 0.0 | 2.8 |
| 80.1 & 80.2 | Security | 6 581 | 112.6 | 0.4 | 1.6 |
| 81 (6) | Services to buildings and landscape | 19 826 | 100.2 | 0.9 | 0.7 |
| 82.20 (3) | Call centre | 4 864 | 104.0 | 0.7 | 1.6 |
- u : unavailable s : statistical secret
- *: Telecommunications prices are known with one quarter delay.
- Source : INSEE, "Observation des prix de l'industrie et des services aux entreprises" survey
graphiquegraph2_telecom_A – Publishing and telecommunications
graphiquegraph6_pro_A – Professional, scientific and technical services
graphiquegraph3_loc_A – Rental and leasing services

graphiquegraph1_info_A – Computer programming and information
graphiquegraph5_pub_A – Advertising and market studies
graphiquegraph4_emploi_A – Employment services
Documentation
Simplified methodology (pdf,134 Ko)
Pour en savoir plus
Time series : Services producer price indices
