


 16 November 2011
2011- n° 279A decrease in enterprise births in October 2011 Enterprise births - October 2011
16 November 2011
2011- n° 279A decrease in enterprise births in October 2011 Enterprise births - October 2011
In October 2011, the number of enterprise births decreased compared to September: -25.0% for enterprise births excluding self-managed enterprises (seasonally and working-day adjusted data); -15.3% when the number of self-managed enterprises (raw data) is added.
Warning : From the August issue, only enterprise births data excluding self-managed enterprises (SME) are seasonally adjusted. In order to get the total of enterprise births, the raw number of SME is added. The SME time series is too short to be properly deseasonalized.
In October 2011, the number of enterprise births decreased compared to September: -25.0% for enterprise births excluding self-managed enterprises (seasonally and working-day adjusted data); -15.3% when the number of self-managed enterprises (raw data) is added.
-10.8% year-on-year (quarterly basis)
The amount of entries, added up August, September and October 2011, decreased by 10.8% compared to the same quarter one year before.
The sectors that most contributed to that decrease were service activities and household services.
-12% year-on-year (twelve months basis)
During the last twelve months, the number of births decreased by 12.0% year-on-year.
244,174 self-managed enterprises since the beginning of 2011
From January to October 2011, one out of every two births enterprises were self-managed enterprises (244,174).
tableautab0EN – Self-managed entreprise births
| July 2011 | Aug. 2011 | Sept. 2011 | Oct. 2011 |
|---|---|---|---|
| 20 584 | 18 353 | 27 728 | 25 843 |
- Source: INSEE (Sirene)
tableautab1EN – Enterprise births by month
| July 2011 | Aug. 2011 | Sept. 2011 | Oct. 2011 | |
|---|---|---|---|---|
| Excl. self-managed enterprises (sa-wda *) | 18 083 | 23 002 | 24 215 | 18 150 |
| Variation [m-o-m] % | -14.0 | 27.2 | 5.3 | -25.0 |
| Incl., in raw data, self-managed enterprises | 38 667 | 41 355 | 51 943 | 43 993 |
| Variation [m-o-m] % | -15.5 | 7.0 | 25.6 | -15.3 |
- * Seasonally and working-day adjusted data
- Source: INSEE (Sirene)
tableautab2EN – Enterprise births by type
| Moving total % change* | Moving total | Moving total | ||
|---|---|---|---|---|
| over 3 months | over 12 months | January- October 2011 | January- October 2010 | |
| Total | -10.8 | -12.0 | 459 236 | 528 324 |
| Companies | 0.6 | 1.2 | 137 958 | 135 849 |
| Individual enterprises | -14.7 | -16.7 | 321 278 | 392 475 |
| Of which self-managed | -15.5 | -19.3 | 244 174 | 308 648 |
- * Total of enterprises births during the last 3 or 12 months compared with the same months a year earlier
- // = meaningless
- Source: INSEE (Sirene)
graphiqueGraph1EN – Enterprise births
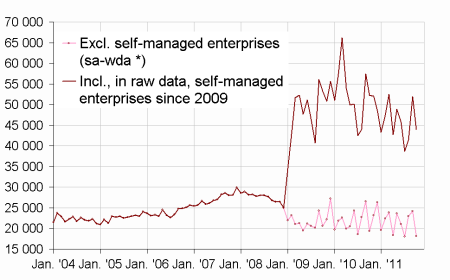
- * Seasonally and working-day adjusted data
- Source: INSEE (Sirene)
Pour en savoir plus
Time series : Business demography
