


 28 October 2011
2011- n° 265Despite September’s decrease (-0.5%), households’ consumption in goods slightly increased
over the third quarter (+0.2%) Household consumption expenditure on goods - September 2011
28 October 2011
2011- n° 265Despite September’s decrease (-0.5%), households’ consumption in goods slightly increased
over the third quarter (+0.2%) Household consumption expenditure on goods - September 2011
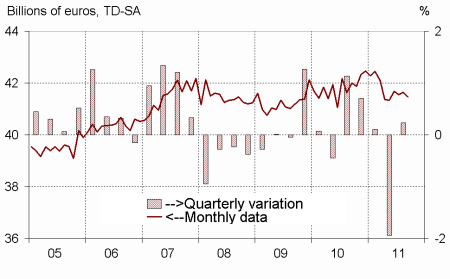
In September, households’ expenditure in goods decreased by 0.5% in volume*, after having increased by 0.2% in August. Over the third quarter, they increased by 0.2% (after -1.9% in Q2). The decrease in September is mainly imputable to a fall of expenditures in energy and textile-leather .
In September, households’ expenditure in goods decreased by 0.5% in volume*, after having increased by 0.2% in August. Over the third quarter, they increased by 0.2% (after -1.9% in Q2). The decrease in September is mainly imputable to a fall of expenditures in energy and textile-leather .
[* Volumes are chained and all figures are trading days and seasonally adjusted.]
Engineered goods : slightly increasing
Durables : increasing
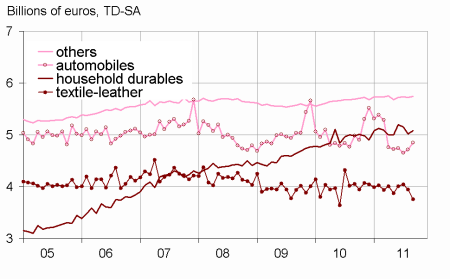
After a decrease in August , households’ expenditure in durables bounced in September (+1.9% after –0.3%). Over the third quarter, they increased by 0.4%, after –6.2% in Q2. This is notably due to an acceleration in car purchases (+2.8% in September, after +1.4% in August), driven up by the secondhand market, but also to purchases in household durables (+1.3% in September, after -2.7% in August). Over the quarter, expenditure in car purchases are stable (after -11.0% in Q2) and household durables rose (+0.4%, after -0.7%).
Textile-leather : sharply decreasing
Purchases in textile and leather declined again in September (-4.7% after -2.5% in August). They decreased by 1.2% over the quarter, after -0.5% in Q2.
Other engineered goods : slightly increasing
Expenditure in other engineered goods slightly increased in September (+0.2%, after -0.1% in August), and over the quarter (+0.2% after -0.3% in Q2).
graphiquegraph1_new_ang – Total consumption of goods
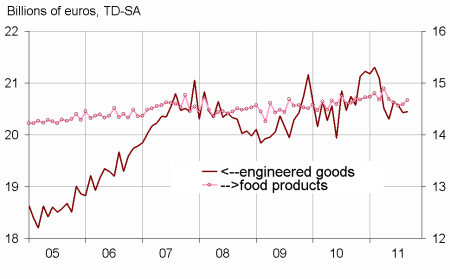
graphiquegraph2_new_ang – Food and engineered goods
graphiquegraph3_new_ang – Decomposition of engineered goods
Food products : increasing
Households’ expenditure in food products accelerated in September (+0.5% after +0.2% in August), notably driven up by expenditures in tobacco, probably in anticipation of the price increase in October. However, food products’ consumption decreased over the third quarter (-0.9% with respect to Q2).
Energy : decreasing
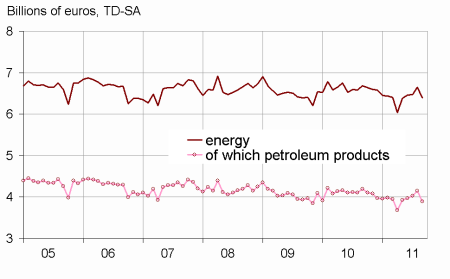
After an increase in August (+2.8%), consumption of energy products decreased in September (-4.0%), in particular for petroleum products. Over the third quarter, it nevertheless increased by 3.3%, after -2.1% in Q2.
The increase of household consumption in goods in August is not revised
The increase of household consumption in goods in August is still estimated at +0.2%.
tableauenglish_trim – Households consumption expenditures in manufactured goods
| Juillet | Août | Sept. | Sept.11/ | Q3 11/ | |
|---|---|---|---|---|---|
| 2011 | 2011 | 2011 | Sept.10 | Q2 11/ | |
| Food products | 14.560 | 14.591 | 14.671 | ||
| Change (%) | –0.5 | 0.2 | 0.5 | 0.3 | –0.9 |
| Engineered products | 20.572 | 20.427 | 20.445 | ||
| change (%) | –0.3 | –0.7 | 0.1 | –1.4 | –0.0 |
| Of which: | |||||
| Automobiles | 4.654 | 4.718 | 4.848 | ||
| Change (%) | –1.8 | 1.4 | 2.8 | –2.8 | 0.0 |
| Household dura- bles | 5.154 | 5.015 | 5.078 | ||
| Change (%) | –0.8 | –2.7 | 1.3 | 1.9 | 0.4 |
| Textile-leather | 4.045 | 3.943 | 3.757 | ||
| Change (%) | 0.9 | –2.5 | –4.7 | –7.3 | –1.2 |
| Other engineered goods | 5.733 | 5.724 | 5.738 | ||
| Change (%) | 0.2 | –0.1 | 0.2 | 0.8 | 0.2 |
| Energy | 6.470 | 6.652 | 6.388 | ||
| Change (%) | 0.1 | 2.8 | –4.0 | –4.4 | 3.3 |
| Of which petroleum products | 4.022 | 4.146 | 3.890 | ||
| Change (%) | 1.3 | 3.1 | –6.2 | –7.3 | 4.2 |
| Total | 41.551 | 41.650 | 41.457 | ||
| Change (%) | –0.3 | 0.2 | –0.5 | –1.3 | 0.2 |
| Manufactured goods | 36.055 | 36.073 | 36.008 | ||
| Change (%) | –0.4 | 0.0 | –0.2 | –1.0 | –0.2 |
graphiquegraph4_new_ang – Energy
Documentation
Methodology (pdf,23 Ko)
Pour en savoir plus
