


 13 June 2013
2013- n° 137In May 2013, oil prices declined slightly Prices of oil and raw material imports - May 2013
13 June 2013
2013- n° 137In May 2013, oil prices declined slightly Prices of oil and raw material imports - May 2013
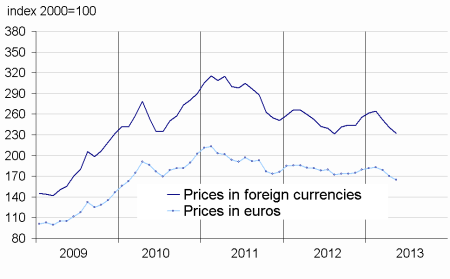
In May, the crude oil price in euro terms fell slightly (-0.4% after -5.9% in April), reaching € 79.4 per barrel of Brent. Prices of commodities except energy imported into France also receded slightly in euros terms (-0.8% after -3.9% in April).
In May, the crude oil price in euro terms fell slightly (-0.4% after -5.9% in April), reaching € 79.4 per barrel of Brent. Prices of commodities except energy imported into France also receded slightly in euros terms (-0.8% after -3.9% in April).
Small decline in oil prices
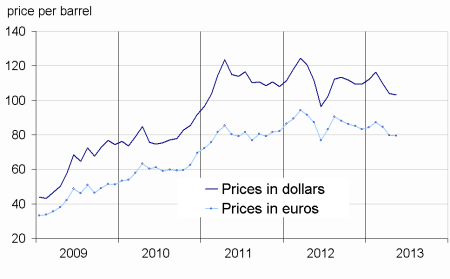
In May, the fall in the price of crude oil from the North Sea (Brent) in dollars terms was less pronounced than in April (-0.8% after -5.3%). It stood at $103.0 per barrel. In euros terms, the decrease is slightly weaker (-0.4% after -5.9%), due to a slight decrease of the euro (-0.4% against the dollar).
The decline in prices of imported industrial raw material continued
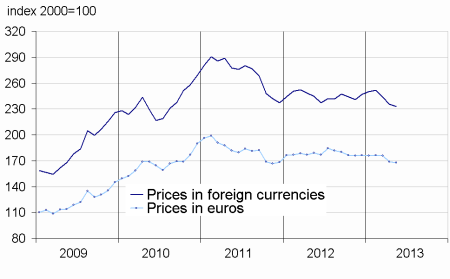
In May, prices of industrial raw materials in euros terms continued to decline (-3.2% after -4.7% in April). Prices of mineral raw materials decreased again (-3.1% after -5.0%). Prices of non-ferrous metals slumped (-1.0% after –5.3%). In particular, prices of aluminum (–1.0%), nickel (–4.0%), zinc (-0.9%) and titanium (-3.0%) declined. Prices of precious metals also declined (–4.4% after –8.9%). This decrease affected mainly the prices of silver (-8.3%) and gold (-4.5%). There was a small decline in prices of platinum (-0.6%), while prices of palladium (+3.3%) recovered as a result of an increased world’s demand. Eventually, the fall in the price of iron ore has been very high (–9.4% after –2.3%).
Moreover, prices of agro-industrial raw materials decreased sharply again in May (-3.8%). In particular, prices of sawn softwood (-14.0%) dropped significantly, while those of tropical sawn wood (+0.2%) and wood pulp (+1.6%) continued to rise. Prices of natural textile fibers were slightly up (+0.2%), especially because of the rebound in cotton prices (+0.3% after -2.4%).
The prices of raw food materials rebounded
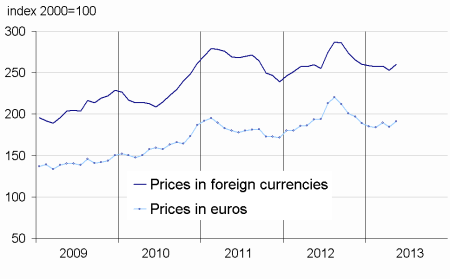
In May, prices of raw food materials in euros terms rose again (+3.4% after -2.6%). Prices of oilseeds recovered strongly (+5.8% after –3.2%) due to an increase of soybean meal (+5.8%) and soybeans (+5.2%) prices, which are driven up by concerns over the production in the United States. Prices of tropical foodstuff (+1.2% after +1.0%)
also continued to rise. In particular, there was a further increase in cocoa prices (+2.7% after +5.9%). Meanwhile, prices of cereals rebounded (+1.5% after -5.8%), due to an increase in the price of corn (+4.0% after –11%). Prices of meat (+3.3%) also increased. However, prices of sugar fell again (-3.2% after –3.8%), due to better production prospects in Brazil.
tableautabpetrole – Oil and petroleum products
| Prices | Change (%) | |||
|---|---|---|---|---|
| of last month | over the last month | over the last 3 months | over the last 12 months | |
| Brent in $ per barrel | 103.0 | –0.8 | –11.5 | –7.6 |
| Brent in € per barrel | 79.4 | –0.4 | –8.9 | –8.9 |
| Gasoline €/L | 0.56 | 1.0 | –7.6 | –5.8 |
| Gas Oil | 662.8 | –0.1 | –11.2 | –9.2 |
| Heavy fuel | 462.6 | 2.0 | –7.4 | –12.5 |
| Naphtha | 639.4 | 1.6 | –13.3 | –7.2 |
- Prices are in euros per tonne unless otherwise specified
- Source : INSEE
tableautabmatprem – Imported raw materials (excluding energy) in euros
| Index | Changes (%) | |||
|---|---|---|---|---|
| over the last month | over the last 3 months | over the last 12 months | ||
| Food total | 191.0 | 3.4 | 4.0 | –1.3 |
| Tropical foodstuff | 148.7 | 1.2 | 3.6 | –8.7 |
| Oil seeds. vegetable oils | 248.3 | 5.8 | 3.9 | 5.5 |
| Cereals | 207.0 | 1.5 | –1.5 | –5.4 |
| Sugar | 147.3 | –3.2 | –3.6 | –16.9 |
| Beef meat | 124.5 | 3.3 | 8.8 | 1.3 |
| Industrial raw materials | 164.9 | –3.2 | –9.8 | –9.3 |
| Agricultural raw materials | 106.3 | –3.8 | –4.2 | –4.7 |
| Natural Fibers | 134.3 | 0.1 | 4.3 | 1.6 |
| Natural rubber | 274.0 | 0.8 | –15.1 | –26.8 |
| Hides | 88.2 | 0.0 | 2.7 | 14.6 |
| Wood pulp | 89.1 | 1.6 | 5.1 | –0.7 |
| Tropical wood | 98.2 | 0.2 | 1.7 | –7.9 |
| Sawn softwood | 90.9 | –14.0 | –11.7 | 5.4 |
| Minerals | 196.9 | –3.1 | –11.5 | –10.6 |
| Iron ore | 707.3 | –9.4 | –17.5 | –10.3 |
| Non-ferrous metals | 149.7 | –1.0 | –9.4 | –10.7 |
| Precious metals | 254.8 | –4.4 | –13.4 | –11.5 |
| All commodities | 167.5 | –0.8 | –4.9 | –6.3 |
- Source : INSEE
graphiqueG_petrole_ang – Oil
- Source : INSEE
graphiqueG_alim_ang – Food
- Source : INSEE
graphiqueG_ensemble_ang – All commodities
- Source : INSEE
graphiqueG_indus_ang – Industrial raw materials
- Source : INSEE
Pour en savoir plus
Time series : Raw materials prices
