


 14 December 2012
2012- n° 304Decrease in business setting up in November 2012 Enterprise births - november 2012
14 December 2012
2012- n° 304Decrease in business setting up in November 2012 Enterprise births - november 2012
In November 2012, the number of business start-ups decreased compared to October: -0.3% for business setting up excluding self-managed enterprises (seasonally and working-day adjusted data); -12.1% if the number of self-managed enterprises (raw data) is added.
Warning : Only business start-ups data excluding self-managed enterprises (SME) are seasonally adjusted. In February 2012, the seasonal adjustment model has been reviewed. In order to get the total of enterprise births, the raw number of SME is added. The SME time series is too short to be properly deseasonalized.
In November 2012, the number of business start-ups decreased compared to October: -0.3% for business setting up excluding self-managed enterprises (seasonally and working-day adjusted data); -12.1% if the number of self-managed enterprises (raw data) is added.
-0.8% year-on-year (quarterly basis)
The amount of entries added up September, October and November 2012 decreased compared to the same months one year before (-0.8%).
The sectors that most contributed to that decrease were “real estate activities” and business support service activities.
+1.2% year-on-year (twelve months basis)
During the last twelve months, the number of business start-ups decreased by 1.2% year-on-year.
290,116 self-managed enterprises since the beginning of 2012
For the first eleven months of 2012, more than one out of two business setting up were self-managed enterprises (290,116).
tableautab0EN – Self-managed business setting up
| Aug. 2012 | sept 2012 | Oct. 2012 | Nov. 2012 |
|---|---|---|---|
| 20 763 | 26 289 | 30 958 | 24 852 |
- Source: INSEE (Sirene)
tableautab1EN – Business setting up by month
| Aug. 2012 | sept 2012 | Oct. 2012 | Nov. 2012 | |
|---|---|---|---|---|
| Excl. self-managed enterprises (sa-wda *) | 20 506 | 19 791 | 19 986 | 19 919 |
| Variation [m-o-m] % | 2.1 | -3.5 | 1.0 | -0.3 |
| Incl., in raw data, self-managed enterprises | 41 269 | 46 080 | 50 944 | 44 771 |
| Variation [m-o-m] % | -6.1 | 11.7 | 10.6 | -12.1 |
- * Seasonally and working-day adjusted data
- Source: INSEE (Sirene)
tableautab2EN – business start-ups by type
| Moving total % change* | Moving total | Moving total | ||
|---|---|---|---|---|
| over 3 months | over 12 months | January- November 2012 | January- November 2011 | |
| Total | -0.8 | 1.2 | 513 496 | 505 776 |
| Companies | -4.2 | -2.7 | 146 788 | 151 378 |
| Individual enterprises | 0.5 | 2.8 | 366 708 | 354 398 |
| Of which self-managed | 2.9 | 6.5 | 290 116 | 270 358 |
- * Total of enterprises births during the last 3 or 12 months compared with the same months a year earlier
- // = meaningless
- Source: INSEE (Sirene)
graphiqueGraph1EN – Business start-ups
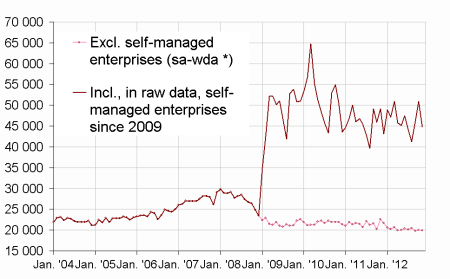
- * Seasonally and working-day adjusted data
- Source: INSEE (Sirene)
Pour en savoir plus
Time series : Business demography
