


 31 January 2013
2013- n° 26Households consumption of goods was stable in December, slightly decreased over the
fourth quarter (-0.1%) Household consumption expenditure on goods - December 2012
31 January 2013
2013- n° 26Households consumption of goods was stable in December, slightly decreased over the
fourth quarter (-0.1%) Household consumption expenditure on goods - December 2012
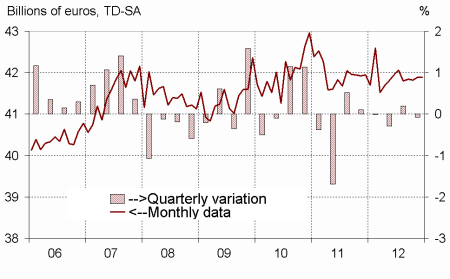
In December, households expenditure on goods were stable in volume*, after a 0.2% increase in November. A bounce in car purchases offset the decline of expenditure on energy products.
In December, households expenditure on goods were stable in volume*, after a 0.2% increase in November. A bounce in car purchases offset the decline of expenditure on energy products.
Over the fourth quarter, consumption of goods slightly decreased (–0.1%, after +0.2% in Q3). Overall in 2012, expenditure on goods decreased by 0.2% on average, after a stability in 2011. Expenditure on manufactured goods decreased by 0.8% in 2012 (after +0.9% in 2011), the largest decline since 1993.
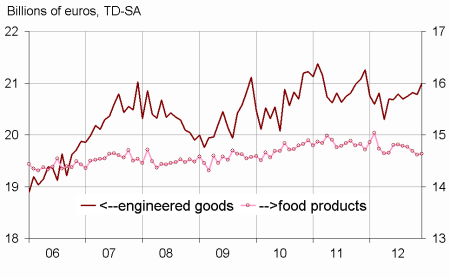
Engineered goods : increasing
Durables: rebound at the end of the year
Households expenditure on durable goods bounced in December (+2.2%, after –0.2% in November). This acceleration was mainly due to a bounce in car purchases (+4.6%, after –1.0%), partly because households expected a strengthening of penalties on the purchase of polluting cars from January,1st 2013. However purchases in household durables decreased (–0.4%, after +1.8%).
Over the fourth quarter, expenditure on durable goods increased by 1.2%, after +0.1% in Q3. Those on household durables bounced (+1.6%, after –0.4% in Q3). Moreover, expenditure on cars speeded up: +0.9%, after +0.5% in Q3; nevertheless it did not offset the sharp decrease at the beginning of the year: in 2012, car purchases plummeted by 4.4%.
graphiquegraph1_new_ang – Total consumption of goods
graphiquegraph2_new_ang – Food and engineered goods
graphiquegraph3_new_ang – Decomposition of engineered goods
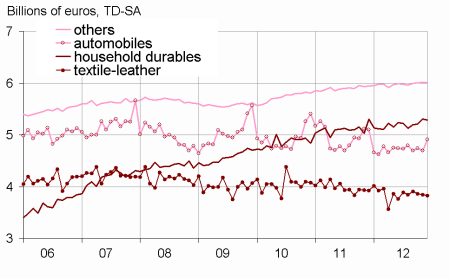
Textile-leather: decreasing
Households consumption of textile and leather decreased again in December (–0.6%, after –0.6% in November); over the quarter, they declined by –0.9%, after a rebound during summer (+3.9%).
Other engineered goods: stability
In December, expenditure on other engineered goods were stable (after +0.2% in November). The fall of expenditure on hardware was offset by the growth of consumption in health products. Over the fourth quarter, the increase is +0.6%, after +0.4% in the previous quarter.
Food products: almost stable
Consumption of food products was almost stable in December (+0.1%, after –0.5% in November). Over the fourth quarter, it dropped by –1.0%, after a 0.6% increase in Q3.
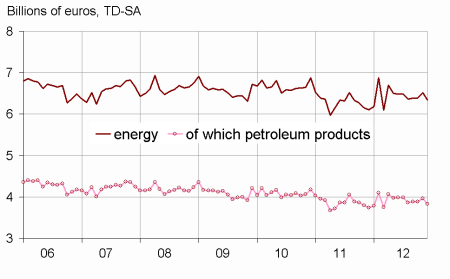
Energy: decreasing
Households consumption of energy products declined in December (–2.8%, after +2.2% in November), Expenditure for heating purposes notably decreased because of particularly mild temperatures at the end of the year. Purchases in carburant declined too. Over the fourth quarter, the consumption of energy products was almost stable (+0.1%), after –2.3% in Q3.
The evolution of household consumption of goods in November is not revised
The increase in consumption of goods in November is still estimated at +0.2%, as it was for the previous publication. Some minor revisions offset each other.
graphiquegraph4_new_ang – Energy
tableauenglish_trim – Households consumption expenditure on goods
| Oct. | Nov. | Déc. | Déc.12/ | Q4 12/ | |
|---|---|---|---|---|---|
| 2012 | 2012 | 2012 | Déc.11 | Q3 12 | |
| Food products | 14.684 | 14.614 | 14.634 | ||
| Change (%) | –0.5 | –0.5 | 0.1 | –0.5 | –1.0 |
| Engineered goods | 20.813 | 20.784 | 20.995 | ||
| change (%) | 0.3 | –0.1 | 1.0 | –1.2 | 0.6 |
| Of which: | |||||
| Automobiles | 4.744 | 4.695 | 4.910 | ||
| Change (%) | 1.1 | –1.0 | 4.6 | –3.8 | 0.9 |
| Household durables | 5.208 | 5.303 | 5.284 | ||
| Change (%) | 0.1 | 1.8 | –0.4 | –0.4 | 1.6 |
| Textile-leather | 3.865 | 3.843 | 3.821 | ||
| Change (%) | –1.0 | –0.6 | –0.6 | –2.6 | –0.3 |
| Other engineered goods | 6.006 | 6.015 | 6.017 | ||
| Change (%) | 0.1 | 0.2 | 0.0 | 1.3 | 0.6 |
| Energy | 6.384 | 6.523 | 6.343 | ||
| Change (%) | 0.1 | 2.2 | –2.8 | 4.0 | 0.1 |
| Including petroleum products | 3.887 | 3.966 | 3.827 | ||
| Change (%) | 0.1 | 2.0 | –3.5 | 2.2 | –0.5 |
| Total | 41.825 | 41.893 | 41.889 | ||
| Change (%) | 0.0 | 0.2 | 0.0 | –0.1 | –0.1 |
| Manufactured goods | 36.249 | 36.229 | 36.319 | ||
| Change (%) | 0.1 | –0.1 | 0.3 | –0.6 | –0.1 |
Documentation
Methodology (pdf,23 Ko)
Pour en savoir plus
