


 11 December 2012
2012- n° 301Strong decrease in payroll employment in Q3 2012 Payroll employment - 3rd Quarter 2012
11 December 2012
2012- n° 301Strong decrease in payroll employment in Q3 2012 Payroll employment - 3rd Quarter 2012
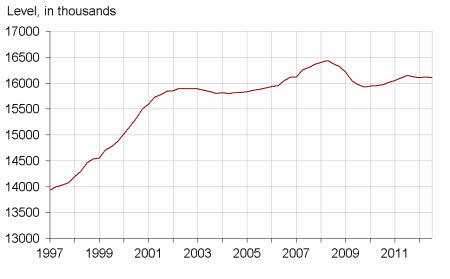
In Q3 2012, payroll employment in principally market sectors decreased by 0.3% q-o-q (- 41,700 jobs), after -0.1% (-16,100) in the previous quarter. Excluding temporary work, employment decreased slightly in Q3 2012 (-10,400 jobs).
In Q3 2012, payroll employment in principally market sectors decreased by 0.3% q-o-q (- 41,700 jobs), after -0.1% (-16,100) in the previous quarter. Excluding temporary work, employment decreased slightly in Q3 2012 (-10,400 jobs).
Job losses in temporary employment
Temporary employment dropped this quarter : -5.7%, after -3.2 % in Q2 2012 (-31,300 jobs).
tableautableau_1 – Payroll employment change in the competitive sector : thousands …
| Change in 3 months | Change in 1 year | Level | ||
|---|---|---|---|---|
| 2012 | 2012 | 2012 | 2012 | |
| Q2 | Q3 | Q3 | Q3 | |
| Principally market sectors | –16,1 | –41,7 | –56,6 | 16061,1 |
| Goods-producing industries excl. Construction | –7,4 | –5,5 | –24,6 | 3272,1 |
| Manufacturing | –10,3 | –7,4 | –31,2 | 2895,6 |
| Construction | –4,7 | –2,7 | –7,6 | 1434,4 |
| Services | –4,0 | –33,5 | –24,5 | 11354,6 |
| of which : Temporary employment | –18,4 | –31,3 | –74,4 | 516,4 |
| Principally non-market sectors (*) | 7,1 | 3,6 | 19,9 | 1949,4 |
| Total competitive sector (*) | –9,1 | –38,1 | –36,7 | 18010,5 |
tableautableau_2 – ... Percentage
| Change in 3 months | Change in 1 year | ||
|---|---|---|---|
| 2012 | 2012 | 2012 | |
| Q2 | Q3 | Q3 | |
| Principally market sectors | –0,1 | –0,3 | –0,4 |
| Goods-producing industries excl. Construction | –0,2 | –0,2 | –0,7 |
| Manufacturing | –0,4 | –0,3 | –1,1 |
| Construction | –0,3 | –0,2 | –0,5 |
| Services | 0,0 | –0,3 | –0,2 |
| of which : Temporary employment | –3,2 | –5,7 | –12,6 |
| Principally non-market sectors (*) | 0,4 | 0,2 | 1,0 |
| Total competitive sector (*) | –0,1 | –0,2 | –0,2 |
- (*) Excl. Agriculture and public employees in non-markets sectors (administration, health, education and social activity) ; na : not available
- Source : INSEE
tableautableau_4 – Payroll employment change in the competitive sector (*)
| Code | Change in 3 months | Change in 1 year | Level | ||
|---|---|---|---|---|---|
| Naf | 2012 | 2012 | 2012 | 2012 | |
| rev.2 | Q2 | Q3 | Q3 | Q3 | |
| DE | Electricity, gas, steam, and air conditioning supply ; water supply, sewerage, waste management and remediation activities | 3,0 | 1,9 | 6,6 | 376,4 |
| C1 | Manufacture of food products beverage and tobacco products | –1,5 | –0,9 | –3,9 | 545,0 |
| C2 | Manufacture of coke, and refined petroleum products | –0,1 | 0,0 | –0,3 | 10,3 |
| C3 | Manufacture of computer, electronic and electrical products; manufacture of machinery and equipment | –0,9 | –1,3 | –3,1 | 452,3 |
| C4 | Manufacture of transport equipment | –0,2 | 0,2 | 3,0 | 372,4 |
| C5 | Other manufacturing | –7,6 | –5,5 | –27,0 | 1515,7 |
| FZ | Construction | –4,7 | –2,7 | –7,6 | 1434,4 |
| GZ | Wholesale and retail trade ; repair of motor vehicles and motorcycles | –0,1 | –2,9 | 0,7 | 3019,5 |
| HZ | Transportation and storage | –0,5 | 0,5 | –2,8 | 1333,2 |
| IZ | Accommodation and food service activities | 4,0 | –0,7 | 10,2 | 977,9 |
| JZ | Information and communication | 1,4 | –0,6 | 5,0 | 717,8 |
| KZ | Financial and insurance activities | 1,1 | 1,0 | 5,1 | 846,8 |
| LZ | Real estate activities | –0,7 | –1,5 | –3,4 | 236,0 |
| MN | Professional, scientific and technical activities; administrative and support service activities | –9,8 | –21,9 | –35,9 | 2901,6 |
| of which : Temporary employment | –18,4 | –31,3 | –74,4 | 516,4 | |
| OQ | Public administration and defence ; compulsory social security; education; human health and social work activities | 7,1 | 3,6 | 19,9 | 1949,4 |
| RU | Other service activities | 0,5 | –7,4 | –3,3 | 1321,8 |
- (*) Excl. Agriculture and public employees in non-markets sectors (administration, health, education and social activity)
- Source : INSEE
graphiqueGraph1 – Payroll employment in principally market sectors
- Source : INSEE
Documentation
Methodology (pdf,135 Ko)
Pour en savoir plus
