


 11 March 2013
2013- n° 56In January 2013, manufacturing output decreased (-1.4%) Industrial production index - January 2013
11 March 2013
2013- n° 56In January 2013, manufacturing output decreased (-1.4%) Industrial production index - January 2013
In January 2013, manufacturing output decreased ( 1.4 %). Output decreased also in industry as a whole (-1.2%).
Warning: from January 2013, the index industrial production is base 2010 and referenced to 2010.
In January 2013, manufacturing output decreased (-1.4 %). Output decreased also in industry as a whole (-1.2%).
Over the last three months, manufacturing output went down by 2.1%…
Over the last three months (q-o-q), output went down in the manufacturing sector (-2.1%), as well as industry as a whole (-1.5%).
Output declined in other manufacturing (-2.1%), in the manufacture of transport equipment (-4.2%) as well as in the manufacture of electrical and electronic equipment (-1.3%) and in the manufacture of food products and beverages (-1.1%). Output declined strongly in the manufacture of coke and refined petroleum products (-6,4%).
…and was lower than its last year’s level by 4.6%.
Manufacturing output fell by 4.6% (y-o-y).
Output went down sharply in other manufacturing (-4.9%), in the manufacture of transport equipment (-10.2%). To a lesser extent, it decreased also in the manufacture of electrical and electronic equipment and machine equipment (-1.2%). It declined dramatically in the manufacture of coke and refined petroleum products (-16.8%).
Please note: all the series are adjusted for seasonal variations (SA) and the number of working days (WDA).
graphiqueGraphique1a – Monthly industrial Production indexes
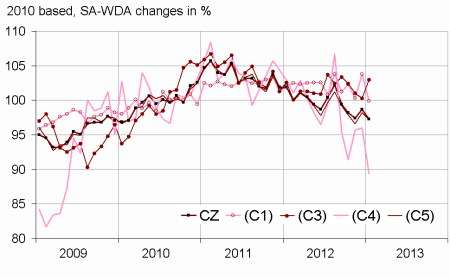
- Legend : CZ : Manufacturing - (C1) : Manufacture of food products and beverages - (C3) : Electrical and electronic equipment; machine equipment - (C4) : Manufacture of transport equipment - (C5) : Other manufacturing
- Sources : Insee, SSP, SOeS
tableauTableau 1 – Variation of the Industrial Production
| NA : A10, (A17) | Jan. / Dec. | Dec. / Nov. | Q-o-Q change | Year on year change (1) |
|---|---|---|---|---|
| BE: INDUSTRY | –1,2 | 0,9 | –1,5 | –3,3 |
| CZ: Manufacturing | –1,4 | 1,3 | –2,1 | –4,6 |
| (C1): Manufacture of food products and beverages | –3,8 | 3,5 | –1,1 | –0,8 |
| (C2): Manufacture of coke and refined petroleum products | 0,7 | –2,2 | –6,4 | –16,8 |
| (C3): Electrical and electronic equipment; machine equipment | 2,7 | –0,7 | –1,3 | –1,2 |
| (C4): Manufacture of transport equipment | –6,9 | 0,3 | –4,2 | –10,2 |
| (C5): Other manufacturing | –1,0 | 1,7 | –2,1 | –4,9 |
| (DE): Mining and quarrying; energy; water supply; waste management | –0,2 | –1,0 | 1,0 | 2,9 |
| FZ: CONSTRUCTION | –4,0 | 0,7 | –2,0 | –5,4 |
- (1) Last three months / three previous months
- (2) Last three months / three same months of previous year
- The codes correspond to the level of aggregation A 10 (A 17) of the "NA" aggregate classification based on NAF rev.2.
- Sources : INSEE, SSP, SOeS
tableauTableau 2 – Variation of the Industrial Production
| NA : A10, (A17), [A38 ou A64] | Jan. 2013 | Jan. / Dec. | Dec. / Nov. | Quarter on quarter change |
|---|---|---|---|---|
| BE: INDUSTRY | 97,0 | –1,2 | 0,9 | –1,5 |
| CZ: Manufacturing | 97,3 | –1,4 | 1,3 | –2,1 |
| (C1): Man. of food products and beverages | 99,9 | –3,8 | 3,5 | –1,1 |
| (C2): Man. of coke and refined petroleum products | 81,3 | 0,7 | –2,2 | –6,4 |
| (C3): Electrical and electronic equipment; machine equipment | 103,0 | 2,7 | –0,7 | –1,3 |
| [CI] Man. of computer, electronic and optical products | 104,5 | 7,6 | –0,1 | 0,2 |
| [CJ] Man. of electrical equipment | 95,7 | 1,3 | –1,6 | –3,8 |
| [CK] Man. of machinery and equipment n.e.c. (1) | 106,6 | 0,7 | –0,5 | –0,7 |
| (C4): Man. of transport equipment | 89,4 | –6,9 | 0,3 | –4,2 |
| [CL1] Man. of motor vehicles, trailers and semi-trailers | 77,7 | –13,5 | 8,8 | –9,1 |
| [CL2] Man. of other transport equipment | 102,7 | –0,3 | –6,9 | 0,7 |
| (C5): Other manufacturing | 97,2 | –1,0 | 1,7 | –2,1 |
| [CB] Man. of textiles, wearing apparel, leather and related products | 98,3 | –1,8 | –2,6 | –2,2 |
| [CC] Man. of wood and paper products; printing and reproduction of recorded media | 91,6 | –1,4 | 4,1 | –0,9 |
| [CE] Man. of chemicals and chemical products | 107,7 | 0,1 | 1,9 | 0,8 |
| [CF] Man. of basic pharmaceutical products and pharmaceutical preparations | 100,1 | 0,3 | 0,1 | –0,1 |
| [CG] Man. of rubber and plastics products, and other non-metallic mineral products | 92,4 | –2,3 | 1,6 | –2,4 |
| [CH] Man. of basic metals and fabricated metal products, except machinery and equipment | 94,9 | –1,9 | 3,0 | –4,8 |
| [CM] Other manufacturing; repair and installation of machinery and equipment | 100,2 | 0,2 | 0,4 | –1,0 |
| (DE): Mining and quarrying; energy; water supply; waste management | 95,8 | –0,2 | –1,0 | 1,0 |
| [BZ] Mining and quarrying | 93,1 | –4,3 | –0,8 | 0,0 |
| [DZ] Electricity, gas, steam and air-conditioning supply | 95,1 | 0,1 | –1,2 | 2,1 |
| [EZ] Water supply; sewerage, waste management and remediation | 102,1 | 0,1 | –0,4 | –5,5 |
| FZ: CONSTRUCTION | 94,7 | –4,0 | 0,7 | –2,0 |
| MIGs (2) | ||||
| Capital goods | 98,1 | –1,3 | 0,2 | –2,0 |
| Intermediate goods | 94,9 | –1,5 | 1,9 | –2,9 |
| Consumer durables | 102,8 | –0,1 | 2,1 | –1,9 |
| Consumer non-durables | 100,7 | –1,9 | 2,0 | –0,7 |
- (1) n.e.c. : not elsewhere classifiable
- (2) Main industrial groupings : definition in Commission regulation EC of 14 June 2007
- Sources : Insee, SSP, SOeS
Output fell dramatically in the manufacture of transport equipment (-6.9%).
Output fell dramatically in the manufacture of other transport equipment (-13.5%). Meanwhile, it decreased slightly in the manufacture of motor vehicles, trailers and semi-trailers (-0.3%).
Output decreased in “other manufacturing” (-1.0%)…
Output declined in the manufacture of basic metals and fabricated metal products, except machinery and equipment (-1.9%), in the manufacture of rubber and plastics products, and other non-metallic mineral products (-2.3%), in the manufacture of wood and paper products; printing and reproduction of record (-1.4%) as well as in the manufacture of textiles, wearing apparel, leather and related products (-1.8%).
…and in the manufacture of food products and beverages (-3.8%).
Output dropped in the manufacture of food products and beverages (-3.8%) after a rise in December mainly due to a high level of beer sales before the raise of the tax.
Output increased in the manufacture of electrical and electronic equipment, machine equipment (+2.7%).
Output soared by 7.6% in the manufacture of computer, electronic and optical products. Output improved in a less sustained pace in the manufacture of electrical equipment (+1.3%) and in the manufacture of machinery and equipment n.e.c. (+0.7%).
Revisions: switch to base 2010.
tableauTableau 3 – Measure of variations’ revisions
| NA : A10, (A17) | Déc. / Nov. | Nov. / Oct. | T4 2012 / T3 2012 | T3 2012 / T2 2012 | 2012 / 2011 |
|---|---|---|---|---|---|
| BE: INDUSTRY | 1.04 | -0.76 | -0.10 | 0.46 | -0.46 |
| CZ: Manufacturing | 1.22 | -0.93 | -0.03 | 0.35 | -0.80 |
| (C1): Man. of food products and beverages | 1.60 | -1.48 | -0.59 | -0.65 | -0.77 |
| (C2): Man. of coke and refined petroleum products | -0.76 | 0.46 | 0.09 | -0.03 | 0.06 |
| (C3): Electrical and electronic equipment; machine equipment | 0.23 | 0.11 | 0.45 | 0.86 | -0.18 |
| (C4): Man. of transport equipment | 1.65 | -0.66 | -0.60 | -0.19 | -1.14 |
| (C5): Other manufacturing | 1.31 | -0.86 | 0.10 | 0.64 | -0.78 |
| (DE) : Industries extractives, énergie, eau | -0.10 | -0.44 | -1.26 | 2.41 | 0.15 |
| FZ : Construction | -0.47 | -0.29 | -0.14 | -0.03 | 0.14 |
- Note of reading : in the manufacturing, the SA-WDA evolution between November and December is revised by +1.22 point.
- Sources : Insee, SSP, SOeS
- Learn more:
Documentation
Methodology (pdf,163 Ko)
Pour en savoir plus
