


 31 May 2012
2012- n° 134Slight decline in oil prices Industrial Producer and Import Price Indices - April 2012
31 May 2012
2012- n° 134Slight decline in oil prices Industrial Producer and Import Price Indices - April 2012
In April, French producer prices in industry were unchanged, following three consecutive monthly increases (+0.5 % in March, +0.7 % in both January and February). This stability was mainly attributable to lower prices for refined petroleum products and a slight drop in prices for “other manufactured products” (–0.1 %), and to a moderate rise in prices for mining and quarrying products and for energy (+0.5 %) due to higher gas prices (+1.6 %).
Producer price indices in French industry
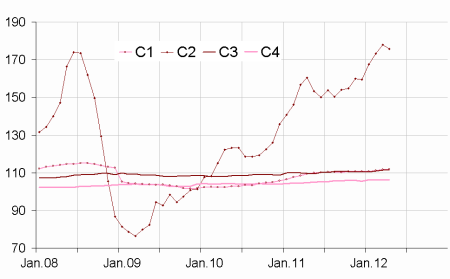
FRENCH MARKET: +0.0 % in April
In April, French producer prices in industry were unchanged, following three consecutive monthly increases (+0.5 % in March, +0.7 % in both January and February). This stability was mainly attributable to lower prices for refined petroleum products and a slight drop in prices for “other manufactured products” (–0.1 %), and to a moderate rise in prices for mining and quarrying products and for energy (+0.5 %) due to higher gas prices (+1.6 %).
Prices for refined petroleum products fell after three consecutive monthly increases
Prices for refined petroleum products fell (-1.4 %), following a period of important increases since January 2012. The drop in price for Brent crude sourced from the North Sea (-3.1 % in dollar terms and -2.7 % in euro terms) contributed to the decline in prices for refined petroleum products, most notably for diesel oil (–1.3 %) and heating oil (-2.3 %).
Food prices rose again
As in March, food prices increased by 0.3 % in April. Meat prices fell slightly (-0.3 %, following +1.1 % in March), while wine prices increased by 0.8 % and prices for "other food products" moved up due to a hike in egg prices (+ 18 % for egg products only).
Prices for "other manufactured products" fell slightly
The very slight drop in prices for "other manufactured products" (-0.1 %), was nevertheless attributable to some important price declines, most notably for textiles due to the seasonal context (-0.5 %) and for pharmaceutical products (-1.3 %) due to a general plan to lower prices launched by the Health authorities.
FOREIGN MARKETS: - 0.1 % in April
Producer prices of French industrial products sold on foreign markets were almost unchanged in April (–0.1 %, following +0.1 % in March). Prices for refined petroleum products were stable (-0.1 %) as prices for other products, except for basic metals and metal products (-0.8 %) due to lower aluminium prices.
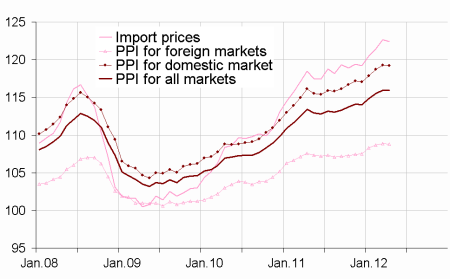
ALL MARKETS: +0.0 % in April
In all markets, producer prices of French industrial products were stable in April, and increased by 2.2 % only year-over-year.
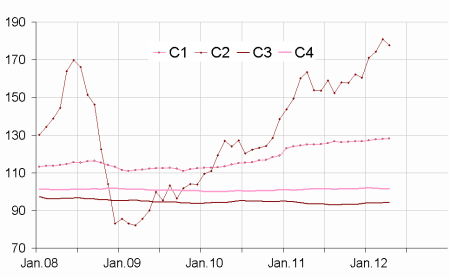
Import prices indices of industrial products : -0.2 % in April
The slight decline in imported industrial products prices (-0.2 %), following a period of consecutive monthly increases since the beginning of the year, was mainly due to lower prices for oil and refined petroleum products. Prices for "other manufactured products" remained on an upward trend, most notably for chemical products (+1.1 %) , and for metal products (+0.8 %).
Regarding food prices (+0.3 %), prices for oils and fats have been continously increasing since November 2011 (+6.5 % in April).
graphiqueGraphique1_EN – Total Industry price indices
graphiqueGraphique2_EN – Producer price indices of manufactured products sold on the french market
graphiqueGraphique3_EN – Import price indices of manufactured products
tableauTableau1 – French Producer Price Indices in industry according to the market where the products are sold:
| Change in % | ||||
|---|---|---|---|---|
| Levels A 10 and A 17 in CPF rev. 2, 2008 | Weight | Apr.12 | In 1 month | In 1 year |
| French market | ||||
| BE:TOTAL INDUSTRY | 1000 | 119.2 | 0.0 | 2.7 |
| (DE) Mining and quarrying, energy, water | 130 | 136.7 | 0.5 | 5.6 |
| CZ: Manufactured prod. | 870 | 116.6 | –0.1 | 2.2 |
| (C1) Food products, beverages, tobacco | 188 | 112.0 | 0.3 | 2.3 |
| (C2) Coke and refined petroleum products | 70 | 175.6 | –1.4 | 9.4 |
| (C3) Electrical & electronic equip., computers, mach. | 92 | 111.5 | 0.2 | 1.7 |
| (C4) Transport equipment | 79 | 106.2 | 0.0 | 1.3 |
| (C5) Other man. products | 441 | 112.1 | –0.1 | 0.7 |
| Foreign markets | ||||
| BE:TOTAL INDUSTRY | 1000 | 108.8 | –0.1 | 1.1 |
| CZ: Manufactured prod. | s | 108.1 | –0.1 | 1.1 |
| (C1) Food products, beverages, tobacco | 82 | 117.8 | 0.1 | 0.9 |
| (C2) Coke and refined petroleum products | 25 | 247.1 | –0.1 | 14.4 |
| (C3) Electrical & electronic equip., computers, mach. | 202 | 96.7 | –0.1 | 0.1 |
| (C4) Transport equipment | 211 | 100.7 | –0.1 | 1.0 |
| (C5) Other man. products | s | 107.4 | –0.2 | 0.1 |
| All markets | ||||
| BE:TOTAL INDUSTRY | 1000 | 115.9 | 0.0 | 2.2 |
| CZ: Manufactured prod. | s | 113.7 | –0.1 | 1.8 |
| (C1) Food products, beverages, tobacco | 154 | 113.0 | 0.3 | 2.0 |
| (C2) Coke and refined petroleum products | 56 | 185.6 | –1.1 | 10.3 |
| (C3) Electrical & electronic equip., computers, mach. | 127 | 104.0 | 0.1 | 1.0 |
| (C4) Transport equipment | 121 | 103.1 | 0.0 | 1.2 |
| (C5) Other man. products | s | 110.6 | –0.1 | 0.5 |
tableauTableau2 – Import prices of industrial products
| Change en % | ||||
|---|---|---|---|---|
| Levels A 10 and A 17 of nomenclature CPF rev. 2, 2008 | Weight | Apr.12 | In 1 month | In 1 year |
| BE:TOTAL INDUSTRY | 1000 | 122.4 | –0.2 | 3.4 |
| CZ: Manufactured prod. | s | 111.2 | 0.2 | 1.8 |
| (C1) Food products, beverages, tobacco | 69 | 128.2 | 0.3 | 2.6 |
| (C2) Coke and refined petroleum products | 41 | 177.8 | –1.7 | 8.8 |
| (C3) Electrical & electronic equip., computers, mach. | 210 | 94.2 | 0.1 | 0.5 |
| (C4) Transport equipment | 133 | 101.6 | 0.1 | 0.4 |
| (C5) Other manufactured products | s | 113.3 | 0.5 | 1.7 |
- r: updated ; nd: non available ; s : confidential
tableauTableau3 – Revision of each index at total industry level
| Jan.12 / Dec.11 | Feb.12 / Jan.12 | Mar.12 / Feb.12 | |
|---|---|---|---|
| French producer prices in industry sold on: | |||
| - the French market | +0.1 | // | // |
| - the foreign markets | // | +0.1 | -0.2(1) |
| - all markets | // | // | // |
| Import prices of industrial products | // | // | // |
- (1) Reading note: the evolution of the index between Feb.12 and Mar.12 published last month was equal to 0.3 %. It is updated to 0.1 %; that is to say a revision of -0.2 %.
Pour en savoir plus
