


 26 January 2012
2012- n° 29In Q4 2012, Demand adressed to business leaders weakens again Quarterly business survey (goods-producing industries) - January 2012
26 January 2012
2012- n° 29In Q4 2012, Demand adressed to business leaders weakens again Quarterly business survey (goods-producing industries) - January 2012
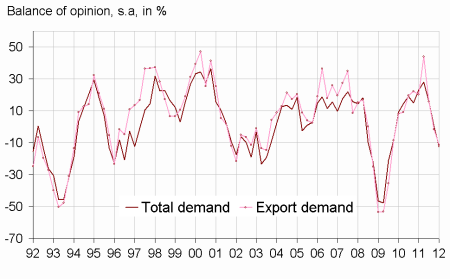
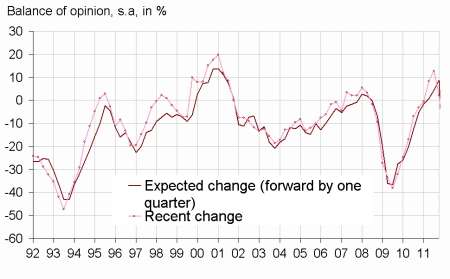
In Q4 2011, global and export demand adressed to business leaders decreased: the corresponding balances fell and are well below their long-term average. The global and export demand outlook for Q1 2012 is still negative: the corresponding balances are below its long-term average.
Manufacturing industry
In Q4 2011, global and export demand adressed to business leaders decreased: the corresponding balances fell and are well below their long-term average. The global and export demand outlook for Q1 2012 is still negative: the corresponding balances are below its long-term average.
Production capacity was less intensely used in Q4 2011: the proportion of businesses encountering production bottlenecks decreases but is still above its long-term average.
According to the business leaders, the industrial manpower slowed down anew in Q4 2011 : the corresponding balance decreased but remains above its long-term average. The industrial manpower could slow down again in Q1 2012.
tableautableau – Business leaders' opinion : Demand and production factors
| Manufacturing industry | MOY* | Apr. 11 | Jul. 11 | Oct. 11 | Jan. 12 |
|---|---|---|---|---|---|
| Total demand | |||||
| Recent changes | 1 | 28 | 16 | 1 | –12 |
| Expected change | 1 | 8 | 7 | –6 | –8 |
| Export demand | |||||
| Recent changes | 3 | 44 | 16 | –1 | –11 |
| Expected change | 5 | 17 | 14 | –4 | 2 |
| Production factors | |||||
| Share of firms producing at full capacity (in%) | 22 | 25 | 25 | 33 | 26 |
| Opinion on production capacity | 14 | 5 | 5 | 9 | 18 |
| Productive capacity utilization rate (in %) | 85 | 83 | 83 | 83 | 82 |
| Difficulties of supply and demand | |||||
| Difficulties of supply and demand | 7 | 9 | 8 | 11 | 10 |
| Difficulties of supply | 20 | 21 | 29 | 26 | 15 |
| Difficulties of demand | 42 | 30 | 30 | 32 | 41 |
- * : Long period average.
- Source : Quarterly business survey - INSEE
graphiqueGraph1ang – Recent changes in demand
graphiqueGraph3ang – Workforce in manufacturing industry
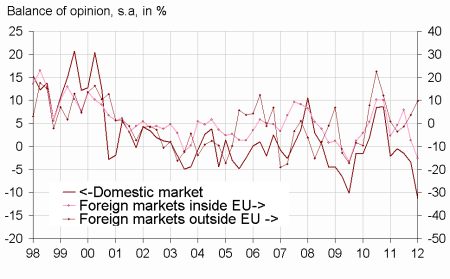
graphiqueGraph4ang – Competitive position
Documentation
Methodology (pdf,48 Ko)
Pour en savoir plus
Time series : Industry
