


 24 May 2012
2012- n° 130In May 2012, the economic climate is deteriorating in services Monthly survey of services - May 2012
24 May 2012
2012- n° 130In May 2012, the economic climate is deteriorating in services Monthly survey of services - May 2012
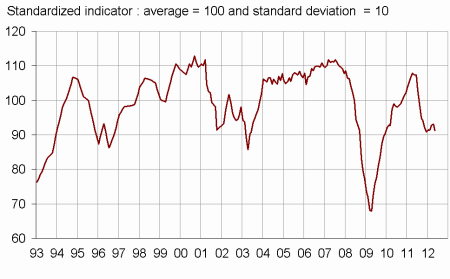
According to the business leaders surveyed in May 2012, the economic situation in services is deteriorating. The business climate synthetic indicator decreases by two points and is 91. He remains below its long-term average. However, the turning point indicator continues to indicate a favourable economic situation.
According to the business leaders surveyed in May 2012, the economic situation in services is deteriorating. The business climate synthetic indicator decreases by two points and is 91. He remains below its long-term average. However, the turning point indicator continues to indicate a favourable economic situation.
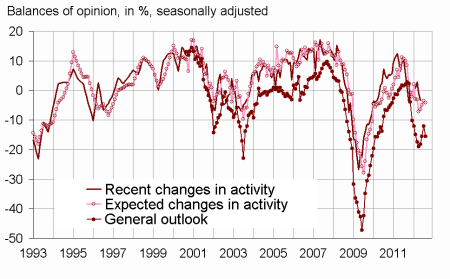
The business leaders consider that their activity decreased during the last few months, and remain pessimistic in their expectations.
The general outlook drops by four points and remains below its long-term average.
graphiqueGraph1 – Business climate synthetic indicator
graphiquegraph_retourn – Turning point indicator
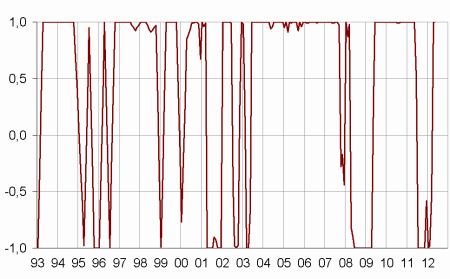
- Note: close to 1 (respectively -1), this indicator indicates a favourable short-term economic situation (respectively unfavourable).
graphiqueGraph2 – Activity
tableauTable_quarter – Economic outlook in the services sector
| Average* | Feb. 12 | Mar. 12 | Apr. 12 | May 12 | |
|---|---|---|---|---|---|
| Business climate synthetic indicator | 100 | 91 | 93 | 93 | 91 |
| General outlook | –5 | –18 | –15 | –12 | –16 |
| Past activity | 4 | 1 | 3 | –1 | –3 |
| Expected activity | 4 | –6 | –5 | –3 | –4 |
| Expected demand | 1 | –14 | –11 | –4 | –6 |
| Business situation | 0 | –6 | –5 | –7 | –12 |
| Past selling prices | –2 | –3 | –1 | –3 | –3 |
| Expected selling prices | –1 | –3 | 0 | –3 | –6 |
| Past employment | 4 | 7 | 1 | –3 | –1 |
| except temporary work agencies | 1 | 2 | 1 | –3 | 2 |
| Expected employment | 3 | –5 | –2 | –2 | –12 |
| except temporary work agencies | 0 | –4 | –3 | –2 | –6 |
| Investments | |||||
| Past investments | 2 | 4 | 1 | 4 | 1 |
| Expected investments | 2 | 1 | 3 | –2 | –3 |
- * Average of the balances of opinion since 1988
- Source: Insee
Documentation
Methodology (2016) (pdf,158 Ko)
Pour en savoir plus
Time series : Economic outlook surveys – Services
