


 28 September 2012
2012- n° 241The slight rise of Services Producer Price Indices continued in the second quarter
of 2012 Services producer price indices - 2nd quarter 2012
28 September 2012
2012- n° 241The slight rise of Services Producer Price Indices continued in the second quarter
of 2012 Services producer price indices - 2nd quarter 2012
Overall services prices continued on an upward trend in the second quarter of 2012 with the notable exception of telecommunications and call centres.
Overall services prices continued on an upward trend in the second quarter of 2012 with the notable exception of telecommunications and call centres.
Information and communication
Increase in edition, decline in telecommunications
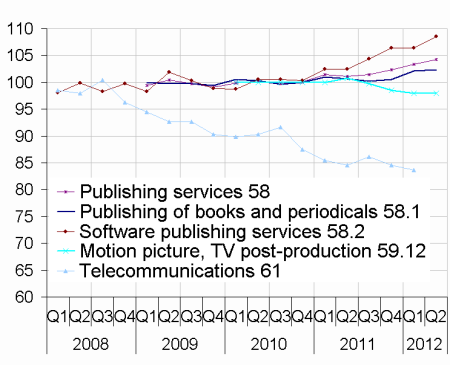
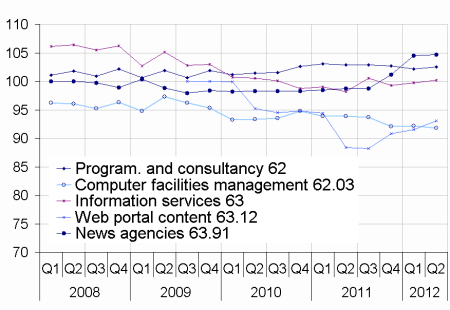
Prices for edition and information services increased this quarter (+0.9 % and +0.5 %) and year-over-year (+2.9 % and +1.2 %). Prices for telecommunications fell according to their past trend (-1.1 % this quarter and -2.1 % year-over-year).
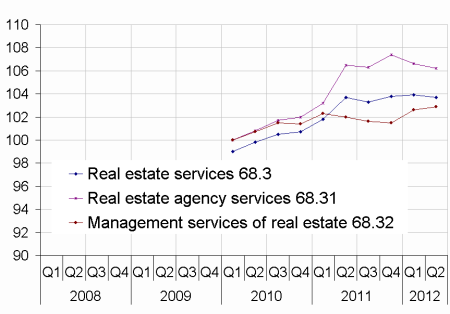
Real estate services
Stable prices in the first half of the year 2012
Altogether, real estate services prices were stable in this beginning of the year. However, they rose by 1.9 % in one year. Real estate agencies prices tended to fall since the fourth quarter of 2011, while real estate management services prices increased slightly.
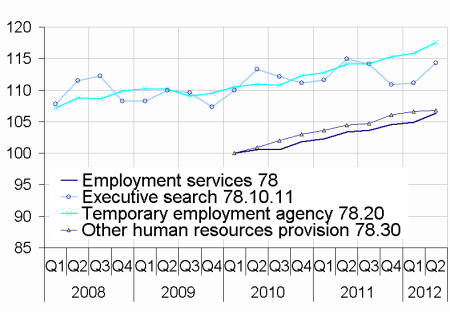
Administrative and support services
Prices for employment services increased
Prices for employment services continued to rise in this second quarter of 2012 (+1.3 % quarter-over-quarter and +3.9 % year-over-year). On the opposite, call center prices fell (-1.5 % quarter-over-quarter and -0.6 % year-over-year). Prices of rental, security and services to buildings and landscape were almost unchanged.
New series are published starting this second quarter of 2012 (in reference 100 = 2010)
tableautableau1 – Services Producer Price Indices : French market
| Divisions and groups in CPA rev. 2, 2008 | Weights (M €) | Indices Q2* 2012 | Changes in % | ||
|---|---|---|---|---|---|
| Q / Q-1 | Q / Q-4 | ||||
| 38.1 & 38.2 (6) | Waste collection, treatment and disposal | 21 252 | 101,8 | 0,7 | 2,1 |
| 53.20 (1) | Other postal and courier services | 555 | 99,5 | 0,4 | 0,3 |
| Information and communication | |||||
| 58 (8) | Publishing services | 24 985 | 104,3 | 0,9 | 2,9 |
| 61 (4) | Telecommunications | 12 650 | 83,7 | –1,1 | –2,1 |
| 62 (1) | Computer programming, consultancy and related services | 45 118 | 102,5 | 0,3 | –0,6 |
| 63 (8) | Information services | 10 204 | 100,2 | 0,5 | 1,2 |
| Real estate services | |||||
| 68.3 (8) | Real estate services on a fee or contract basis | 11 632 | 103,7 | –0,2 | 1,9 |
| Professional, scientific and technical services | |||||
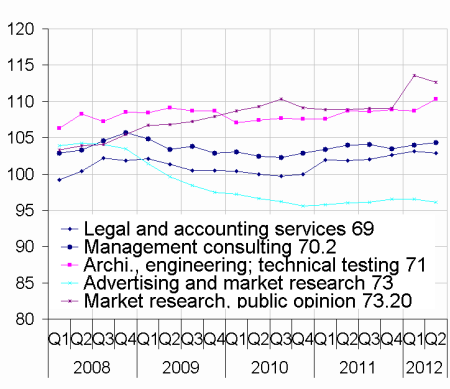
| 69 (8) | Legal and accounting services | 32 514 | 102,9 | –0,2 | 1,0 |
| 70.2 (1) | Management consulting | 22 565 | 104,3 | 0,3 | 0,9 |
| 71 (2) | Architectural and engineering services; technical testing and analysis services | 49 881 | 110,3 | 1,5 | 2,5 |
| 73 (3) | Advertising and market research | 19 960 | 96,1 | –0,4 | 0,3 |
| Administrative and support services | |||||
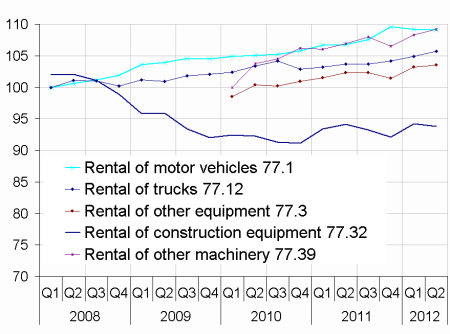
| 77.1 (5) | Rental of motor vehicles | 8 121 | 109,1 | –0,1 | 2,2 |
| 77.3 (8) | Rental of other machinery, equipment and tangible goods | 18 064 | 103,5 | 0,3 | 2,0 |
| 78 (7) | Employment services | 28 623 | 106,3 | 1,3 | 3,9 |
| 80.1 & 80.2 (1) | Security | 6 581 | 115,3 | 0,3 | 2,4 |
| 81 (7) | Services to buildings and landscape | 19 826 | 102,0 | 0,3 | 1,1 |
| 82.20 (5) | Call centres | 4 864 | 101,8 | -1,5 | –0,6 |
- u : unavailable s : statistical secret
- *: Telecommunications prices are known with one quarter delay.
- Source : INSEE, "Observation des prix de l'industrie et des services aux entreprises" survey
graphiquegraph2_telecom_A – Publishing and telecommunications
graphiquegraph6_pro_A – Professional, scientific and technical services
graphiquegraph3_loc_A – Rental and leasing services
graphiquegraph1_info_A – Computer programming and information
graphiquegraph5_immo_A – Real estate
graphiquegraph4_emploi_A – Employment services
Documentation
Simplified methodology (pdf,134 Ko)
Pour en savoir plus
Time series : Services producer price indices
