


 25 September 2012
2012- n° 233The economic climate stays deteriorated in the building industry in September 2012 Monthly survey of building - September 2012
25 September 2012
2012- n° 233The economic climate stays deteriorated in the building industry in September 2012 Monthly survey of building - September 2012
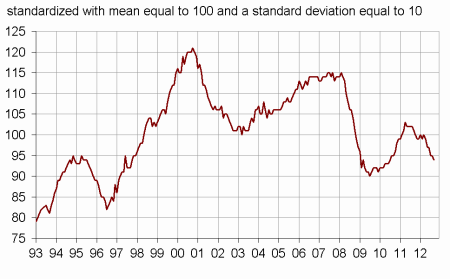
According to the business leaders surveyed in September 2012, the situation is deteriorated in the building industry: the synthetic indicator of business climate loses one point in September, and remains below its long-term average. The turning-point indicator is again in the unfavorable zone.
According to the business leaders surveyed in September 2012, the situation is deteriorated in the building industry: the synthetic indicator of business climate loses one point in September, and remains below its long-term average. The turning-point indicator is again in the unfavorable zone.
graphiqueClimate – Business climate synthetic indicator
graphiqueTurningPoint – Turning-point indicator
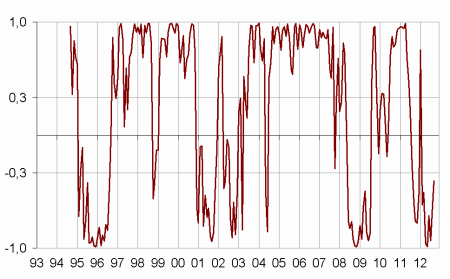
- Lecture : close to 1 (respectively -1), it indicates a favorable climate (respectively unfavorable).
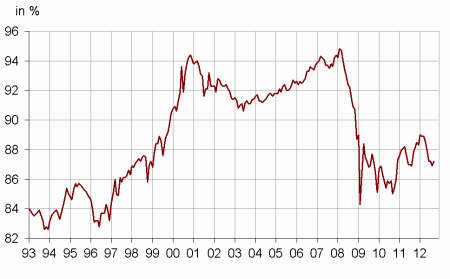
graphiquePcur – Productive capacity utilisation rate
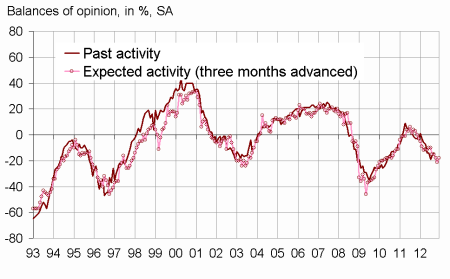
graphiqueActivity – Activity tendency in the building industry
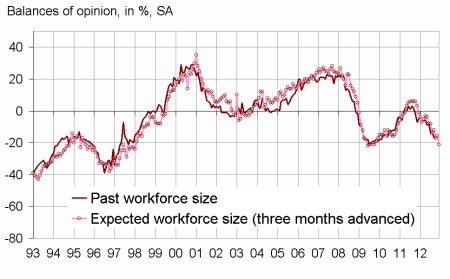
graphiqueWorkforce – Workforce size tendency in the building industry
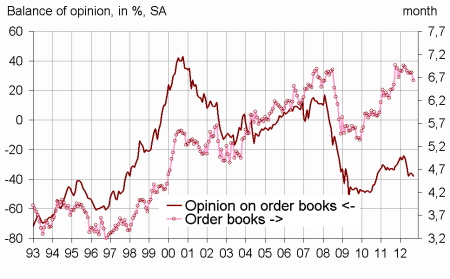
graphiqueOrderBooks – Order books
tableauTableau1 – Building industry economic outlook
Balances of opinion, in %, SA
| Mean* | Jun. 12 | July. 12 | Aug. 12 | Sept. 12 | |
|---|---|---|---|---|---|
| Business climate | 100 | 97 | 95 | 95 | 94 |
| Past activity | –1 | –14 | –19 | –16 | –14 |
| Expected activity | –4 | –15 | –18 | –21 | –18 |
| Gen. business outlook | –16 | –44 | |||
| Past employment | –2 | –8 | –14 | –12 | –17 |
| Expected employment | –2 | –12 | –17 | –16 | –21 |
| Opinion on order books | –19 | –38 | –36 | –36 | –38 |
| Order books (in month) | 5,2 | 6,8 | 6,8 | 6,8 | 6,6 |
| Productive capacity utilisation rate | 89,1 | 87,2 | 87,2 | 86,9 | 87,2 |
| Obstacles to production increase (in %) | 34 | 23 | 26 | 24 | 24 |
| - Because of workforce shortage(in %)** | 16,3 | 7,3 | 6,4 | 5,9 | 5,8 |
| Hiring problems (in %) | 60 | 55 | |||
| Expected prices | –11 | –25 | –33 | –36 | –35 |
| Cash-flow position | –8 | –26 | |||
| Repayment period | 27 | 41 |
- * Mean since september 1993.
- ** This figure refers to all companies that responded to the survey.
Documentation
Methodology (2016) (pdf,170 Ko)
Pour en savoir plus
: bureau-de-presse@insee.fr
