


 24 July 2012
2012- n° 185The economic climate is deteriorating in the building industry in July 2012 Monthly survey of building - July 2012
24 July 2012
2012- n° 185The economic climate is deteriorating in the building industry in July 2012 Monthly survey of building - July 2012
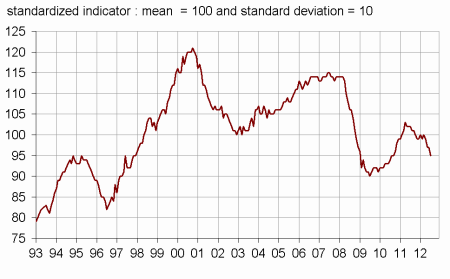
In the building industry, the synthetic indicator of business climate, built with balances of opinion, loses two points in July and stays under its long-term average. The turning-point indicator is again in the unfavorable zone.
In the building industry, the synthetic indicator of business climate, built with balances of opinion, loses two points in July and stays under its long-term average. The turning-point indicator is again in the unfavorable zone.
tableauTableau1 – Building industry economic outlook
Balances of opinion, in %, SA
| Mean* | Apr. 12 | May. 12 | Jun. 12 | July. 12 | |
|---|---|---|---|---|---|
| Business climate | 100 | 99 | 97 | 97 | 95 |
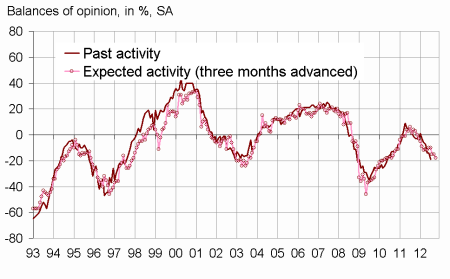
| Past activity | –1 | –7 | –14 | –14 | –19 |
| Expected activity | –4 | –10 | –15 | –15 | –18 |
| Gen. business outlook | –16 | –24 | –44 | ||
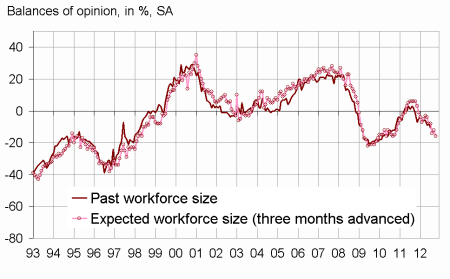
| Past employment | –2 | –6 | –9 | –8 | –11 |
| Expected employment | –1 | –8 | –14 | –12 | –16 |
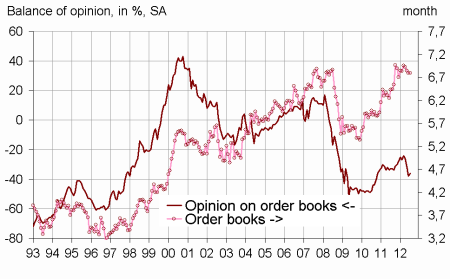
| Opinion on order books | –18 | –26 | –32 | –38 | –36 |
| Order books (in month) | 5,1 | 6,9 | 6,8 | 6,8 | 6,8 |
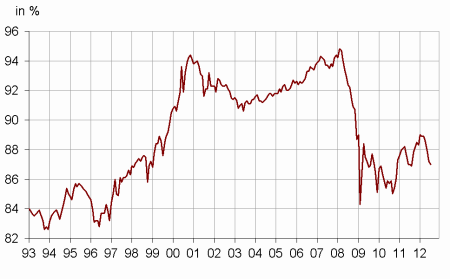
| Productive capacity utilisation rate | 89,1 | 88,6 | 88 | 87,2 | 87 |
| Obstacles to production increase (in %) | 34 | 25 | 26 | 23 | 26 |
| - Because of workforce shortage(in %)** | 16,4 | 8,7 | 8,4 | 7,3 | 7,6 |
| Hiring problems (in %) | 60 | 53 | 55 | ||
| Expected prices | –11 | –23 | –27 | –25 | –34 |
| Cash-flow position | –8 | –22 | –26 | ||
| Repayment period | 27 | 38 | 41 |
- * Mean since september 1993.
- ** This figure refers to all companies that responded to the survey.
graphiqueClimate – Business climate synthetic indicator
graphiqueTurningPoint – Turning-point indicator
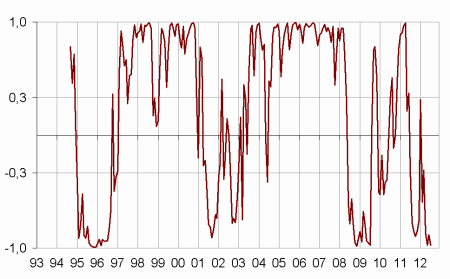
- Lecture : close to 1 (respectively -1), it indicates a favorable climate (respectively unfavorable).
graphiquePcur – Productive capacity utilisation rate
graphiqueActivity – Activity tendency in the building industry
graphiqueWorkforce – Workforce size tendency in the building industry
graphiqueOrderBooks – Order books
Documentation
Methodology (2016) (pdf,170 Ko)
Pour en savoir plus
: bureau-de-presse@insee.fr
