


Quarterly national accounts in Q2 2014 National accounts in base 2010 - Detailed results
In Q2 2014, French GDP held steady Quarterly national accounts - second estimate - 2nd Quarter 2014
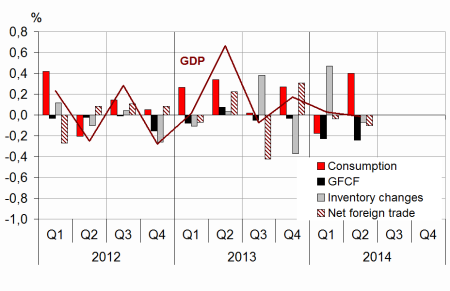
In Q2 2014, French gross domestic product (GDP) in volume* remained steady (0.0%).
In Q2 2014, French gross domestic product (GDP) in volume* remained steady (0.0%).
Household consumption expenditure upturned (+0.5% after –0.5%) while total gross fixed capital formation (GFCF) remained depressed (–1.1% after –1.0%). All in all, final domestic demand (excluding changes in inventories) slightly increased and contributed positively to GDP evolution in Q2 (+0.2 points after –0.4 points in Q1 2014).
Imports slightly decelerated (+0.4% after +0.6%), while exports were steady (0.0% after +0.5%). Consequently, the foreign trade balance contributed negatively to activity (–0.1 points) after a neutral contribution the previous quarter. Changes in inventories also contributed negatively (–0.1 points after +0.5 points).
Total production remained unchanged
In Q2 2014, production in goods and services was flat (–0.1% after +0.2%). Output in manufactured goods decreased anew (–1.0% after +0.8%), in most branches and especially that of coke and refined petroleum. This decrease in output of manufactured goods is partly due to the high number of potential extra days off this quarter due to midweek public holidays. At the same time, production in tradable services was almost unchanged (+0.1% after +0.2%). While output in energy, water and waste bounced back (+2.1% after –1.6%), output in construction was still depressed (–1.5% after –1.6%)
graphiqueGraph1 – GDP and its main components
tableauTab1 – Goods and services:supply and uses chain-linked volumes
| 2013 Q3 | 2013 Q4 | 2014 Q1 | 2014 Q2 | 2013 | 2014 (ovhg) | |
|---|---|---|---|---|---|---|
| GDP | -0.1 | 0.2 | 0.0 | 0.0 | 0.4 | 0.3 |
| Imports | 0.9 | 0.3 | 0.6 | 0.4 | 1.9 | 2.1 |
| Household' consumption *expenditure | -0.1 | 0.2 | -0.5 | 0.5 | 0.3 | 0.0 |
| General government's *consumption expenditure | 0.3 | 0.6 | 0.4 | 0.5 | 2.0 | 1.6 |
| GFCF | -0.2 | -0.1 | -1.0 | -1.1 | -0.8 | -2.0 |
| *of which Non financial corporated and unincorporated enterprises | 0.2 | 0.8 | -0.7 | -0.8 | -0.6 | -0.5 |
| Households | -1.8 | -2.1 | -2.9 | -2.4 | -3.1 | -7.0 |
| General government | 0.4 | -0.3 | 0.0 | -0.5 | 1.1 | -0.2 |
| Exports | -0.5 | 1.4 | 0.5 | 0.0 | 2.4 | 2.1 |
| Contributions : | ||||||
| Internal demand excluding inventory changes | 0.0 | 0.2 | -0.4 | 0.2 | 0.4 | 0.0 |
| Inventory changes | 0.4 | -0.4 | 0.5 | -0.1 | -0.2 | 0.4 |
| Net foreign trade | -0.4 | 0.3 | 0.0 | -0.1 | 0.1 | 0.0 |
tableauTab2 – Sectoral accounts
| 2013 Q3 | 2013 Q4 | 2014 Q1 | 2014 Q2 | 2013 | 2014 (ovhg) | |
|---|---|---|---|---|---|---|
| Profit ratio of NFC* (level) | 29.5 | 29.4 | 30.0 | 29.8 | ||
| Household purchasing power | -0.3 | -0.3 | 0.9 | 0.0 | 1.1 |
- *NFC: non-financial corporations
tableauTab3 – Production, Consumption and GFCF : main componants
| 2013 Q3 | 2013 Q4 | 2014 Q1 | 2014 Q2 | 2013 | 2014 (ovhg) | |
|---|---|---|---|---|---|---|
| Production of branches | -0.2 | 0.2 | 0.2 | -0.1 | 0.5 | 0.4 |
| Goods | -1.3 | -0.2 | 0.4 | -0.4 | -0.2 | -0.4 |
| Manufactured Industry | -1.2 | 0.0 | 0.8 | -1.0 | -0.6 | 0.0 |
| Construction | -0.6 | -0.3 | -1.6 | -1.5 | -1.2 | -3.1 |
| Market services | 0.2 | 0.4 | 0.2 | 0.1 | 0.9 | 0.9 |
| Non-market services | 0.3 | 0.4 | 0.5 | 0.4 | 1.5 | 1.4 |
| Household consumption | -0.1 | 0.2 | -0.5 | 0.5 | 0.3 | 0.0 |
| Food products | 0.3 | 0.9 | -0.9 | 0.9 | 0.1 | 0.4 |
| Energy | -3.8 | -1.3 | -3.9 | 3.5 | 0.8 | -3.9 |
| Engineered goods | 0.7 | 1.2 | 0.0 | 0.1 | -1.0 | 1.3 |
| Services | 0.1 | 0.1 | 0.1 | 0.2 | 0.6 | 0.5 |
| GFCF | -0.2 | -0.1 | -1.0 | -1.1 | -0.8 | -2.0 |
| Manufactured goods | 1.1 | 0.4 | -0.6 | -0.5 | -0.9 | -0.2 |
| Construction | -0.8 | -0.7 | -1.9 | -2.1 | -1.6 | -4.3 |
| Services | -0.3 | 0.3 | -0.1 | -0.1 | 0.3 | 0.2 |
tableauTab4 – Households’ disposable income and ratios of households’ account
| 2013 Q3 | 2013 Q4 | 2014 Q1 | 2014 Q2 | 2013 | 2014 (ovhg) | |
|---|---|---|---|---|---|---|
| HDI | -0.1 | -0.3 | 1.3 | 0.6 | 1.6 | |
| Household purchasing power | -0.3 | -0.3 | 0.9 | 0.0 | 1.1 | |
| HDI by cu* (purchasing power) | -0.4 | -0.5 | 0.8 | -0.6 | 0.6 | |
| Adjusted HDI (purchasing power) | -0.1 | -0.1 | 0.8 | 0.5 | 1.2 | |
| Saving rate (level) | 15.1 | 14.7 | 15.9 | 15.1 | ||
| Financial saving rate (level) | 5.9 | 5.6 | 7.0 | 5.8 |
- *cu: consumption unit
tableauTab5 – Ratios of non-financial corporations’ account
| 2013 Q3 | 2013 Q4 | 2014 Q1 | 2014 Q2 | 2013 | |
|---|---|---|---|---|---|
| Profit share | 29.5 | 29.4 | 30.0 | 29.8 | |
| Investment ratio | 22.6 | 22.8 | 22.6 | 22.6 | |
| Savings ratio | 16.7 | 17.2 | 17.2 | 17.1 | |
| Self-financing ratio | 73.8 | 75.7 | 76.4 | 75.7 |
tableauTab6 – Expenditure, receipts and net borrowing of public administrations
| 2013 Q3 | 2013 Q4 | 2014 Q1 | 2014 Q2 | 2013 | |
|---|---|---|---|---|---|
| In billions of euros | |||||
| Total expenditure | 303.5 | 305.3 | 308.4 | 1208.3 | |
| Total receipts | 281.2 | 283.3 | 284.8 | 1118.7 | |
| Net lending (+) or borrowing (-) | -22.2 | -22.0 | -23.6 | -89.6 | |
| In % of GDP | |||||
| Net lending (+) or borrowing (-) | -4.2 | -4.1 | -4.4 | -4.2 |
Household consumption accelerated
Household consumption expenditure rose by 0.5% in Q2 2014 after –0.5% in Q1. Global expenditure on energy bounced back in Q2 (+3.5% after –3.9%) after rather soft weather conditions in winter. Consumption of food products also bounced back in Q2 (+0.9% après –0.9%). By contrast, expenditure on engineered goods were flat (+0.1 after 0.0%): while car purchases (+0.4% after –1.4%) and expenditure on machinery and equipment goods (+2.9% after +1.0%) accelerated in Q2, clothing expenditure dropped (–2.0% after +0.6%). Meanwhile, expenditure on services remained sluggish (+0.2% after +0.1%).
Total GFCF stepped back again
Total GFCF was still depressed in Q2 (–1.1% after –1.0%). More specifically, construction investment was still decreasing (–2.1% after –1.9%) and so was investment in manufactured goods (–0.5% after –0.6 %), mostly in engineered goods and cars purchases. This decrease in GFCF affected non-financial enterprises (–0.8% after –0.7%), general government (–0.5% after 0.0%) and especially households (–2.4% after –2.9%)
The foreign trade balance contributed negatively to activity
Exports remained the same in Q2 (0.0% after +0.5%) weighed down by a decrease in exported manufactured goods, especially in foods products and transport equipment. Despite a slight deceleration (+0.4% after +0.6%), imports still increased. Overall, the foreign trade balance contributed for -0.1 points to GDP in Q2, after a neutral contribution the previous quarter.
Changes in inventories slightly weighed down GDP change this quarter
In Q2, changes in inventories accounted for –0.1 points of GDP change after +0.5 points the previous quarter. The negative contribution concerned mostly refined petroleum.
Revisions
Revisions on previous quarters are tenuous, evolution of GDP in Q1 2014 (0.0%) and Q4 2013 (+0.2%) are confirmed. The slight revisions are mainly due to the update of seasonal adjustment.
Avertissement
Quarterly national accounts
Quarterly debt of the general government
Sources
Quarterly national accounts
Quarterly accounts are a consistent set of indicators which provides a global overview of recent economic activity.
Time series of the main aggregates of quarterly national accounts can be accessed through the "Summary". They are classified into eight categories:
- Gross domestic product (GDP) and main economic aggregates ;
- Goods and services ;
- Households' consumption ;
- Foreign trade ;
- Activities ;
- Institutional sectors ;
- Households' income and purchasing power ;
- Public finances.
For each category, are available :
- synthetic files displaying from the accounts the relevant information for economic analysis ,
- sometimes, one or two files displaying all the data available.
Documentation
Abbreviated methodology (pdf, 140 Ko )
Methodology - First estimate at 30 days (pdf, 112 Ko )