


Quarterly national accounts in Q2 2014 National accounts in base 2010 - Detailed results
In Q2 2014, French GDP held steady and households’ purchasing power increased (+0.5%) Quarterly national accounts - detailed figures - 2nd quarter 2014
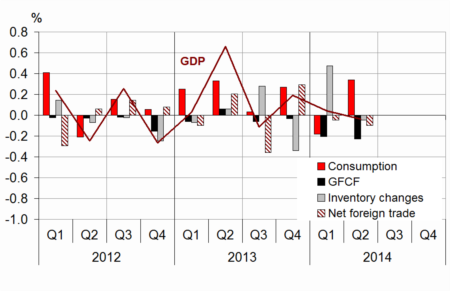
In Q2 2014, as in Q1, French gross domestic product (GDP) in volume terms* remained steady. The previous release (august 14th, 2014) is thus overall confirmed.
In Q2 2014, as in Q1, French gross domestic product (GDP) in volume terms* remained steady. The previous release (august 14th, 2014) is thus overall confirmed.
Households’ consumption expenditure upturned (+0.4% after –0.6%), while total gross fixed capital formation (GFCF) remained depressed (–1.1% after –0.9%). All in all, final domestic demand (excluding changes in inventories) slightly increased and contributed for +0.1 points to GDP evolution (after –0.4 points in Q1).
Imports decelerated (+0.4% after +0.8%), but slightly less than exports (+0.1% after +0.6%). Consequently, the foreign trade balance contributed negatively to activity (–0.1 points). Finally, changes in inventories had a neutral contribution to GDP growth (0.0 points, after +0.5 points in Q1).
Household’s purchasing power rose by 0.5%
Household’s gross disposable income (GDI) decelerated strongly in Q2 2014 (+0.5% after +1.3%). Wages earned by households slightly slowed (+0.4% after +0.5%), notably because of the deceleration of the average wage per capita paid by non-financial corporations (+0.3% after +0.5%). Social benefits also decelerated (+0.3% after +0.6%). Taxes on income and wealth, which had markedly dropped in Q1 (–4.3%) after a strong H2 2013, remained fairly stable in Q2 (–0.5%).
graphiqueGraph1 – GDP and its main components
tableauTab1 – Goods and services:supply and uses chain-linked volumes
| 2013 Q3 | 2013 Q4 | 2014 Q1 | 2014 Q2 | 2013 | 2014 (ovhg) | |
|---|---|---|---|---|---|---|
| GDP | -0.1 | 0.2 | 0.0 | 0.0 | 0.4 | 0.3 |
| Imports | 0.6 | 0.4 | 0.8 | 0.4 | 1.9 | 2.2 |
| Household' consumption *expenditure | -0.1 | 0.2 | -0.6 | 0.4 | 0.3 | 0.0 |
| General government's *consumption expenditure | 0.3 | 0.6 | 0.4 | 0.4 | 2.0 | 1.6 |
| GFCF | -0.3 | -0.1 | -0.9 | -1.1 | -0.8 | -1.9 |
| *of which Non financial corporated and unincorporated enterprises | 0.2 | 0.8 | -0.6 | -0.7 | -0.6 | -0.4 |
| Households | -1.8 | -2.1 | -2.7 | -2.5 | -3.1 | -6.9 |
| General government | 0.3 | -0.4 | 0.1 | -0.7 | 1.1 | -0.4 |
| Exports | -0.6 | 1.5 | 0.6 | 0.1 | 2.4 | 2.2 |
| Contributions : | ||||||
| Internal demand excluding inventory changes | 0.0 | 0.2 | -0.4 | 0.1 | 0.4 | -0.1 |
| Inventory changes | 0.3 | -0.3 | 0.5 | 0.0 | -0.2 | 0.4 |
| Net foreign trade | -0.4 | 0.3 | 0.0 | -0.1 | 0.1 | 0.0 |
tableauTab2 – Sectoral accounts
| 2013 Q3 | 2013 Q4 | 2014 Q1 | 2014 Q2 | 2013 | 2014 (ovhg) | |
|---|---|---|---|---|---|---|
| Profit ratio of NFC* (level) | 29.5 | 29.4 | 29.8 | 29.3 | 29.8 | |
| Household purchasing power | -0.3 | -0.3 | 0.9 | 0.5 | 0.0 | 1.0 |
- *NFC: non-financial corporations
tableauTab3 – Production, Consumption and GFCF : main components
| 2013 Q3 | 2013 Q4 | 2014 Q1 | 2014 Q2 | 2013 | 2014 (ovhg) | |
|---|---|---|---|---|---|---|
| Production of branches | -0.3 | 0.2 | 0.2 | -0.1 | 0.5 | 0.4 |
| Goods | -1.4 | -0.2 | 0.4 | -0.4 | -0.2 | -0.4 |
| Manufactured Industry | -1.4 | 0.1 | 0.8 | -0.9 | -0.6 | 0.0 |
| Construction | -0.5 | -0.3 | -1.5 | -1.7 | -1.2 | -3.1 |
| Market services | 0.2 | 0.4 | 0.3 | 0.2 | 0.9 | 1.0 |
| Non-market services | 0.3 | 0.4 | 0.4 | 0.3 | 1.5 | 1.3 |
| Household consumption | -0.1 | 0.2 | -0.6 | 0.4 | 0.3 | 0.0 |
| Food products | 0.5 | 0.9 | -1.0 | 0.9 | 0.1 | 0.3 |
| Energy | -3.7 | -1.4 | -3.9 | 3.4 | 0.8 | -4.1 |
| Engineered goods | 0.7 | 1.2 | 0.0 | -0.2 | -1.0 | 1.2 |
| Services | 0.1 | 0.1 | 0.2 | 0.1 | 0.6 | 0.5 |
| GFCF | -0.3 | -0.1 | -0.9 | -1.1 | -0.8 | -1.9 |
| Manufactured goods | 1.0 | 0.3 | -0.4 | -0.6 | -0.9 | -0.3 |
| Construction | -0.8 | -0.7 | -1.8 | -2.1 | -1.6 | -4.2 |
| Market services | -0.3 | 0.3 | 0.0 | 0.1 | 0.3 | 0.4 |
tableauTab4 – Households’ disposable income and ratios of households’ account
| 2013 Q3 | 2013 Q4 | 2014 Q1 | 2014 Q2 | 2013 | 2014 (ovhg) | |
|---|---|---|---|---|---|---|
| HDI | -0.1 | -0.3 | 1.3 | 0.5 | 0.6 | 1.4 |
| Household purchasing power | -0.3 | -0.3 | 0.9 | 0.5 | 0.0 | 1.0 |
| HDI by cu* (purchasing power) | -0.5 | -0.5 | 0.8 | 0.3 | -0.6 | 0.4 |
| Adjusted HDI (purchasing power) | -0.2 | -0.1 | 0.8 | 0.5 | 0.5 | 1.1 |
| Saving rate (level) | 15.1 | 14.6 | 15.9 | 15.9 | 15.1 | |
| Financial saving rate (level) | 5.9 | 5.5 | 7.0 | 7.3 | 5.8 |
- *cu: consumption unit
tableauTab5 – Ratios of non-financial corporations’ account
| 2013 Q3 | 2013 Q4 | 2014 Q1 | 2014 Q2 | 2013 | |
|---|---|---|---|---|---|
| Profit share | 29.5 | 29.4 | 29.8 | 29.3 | 29.8 |
| Investment ratio | 22.6 | 22.8 | 22.6 | 22.5 | 22.6 |
| Savings ratio | 16.7 | 17.1 | 17.0 | 17.0 | 17.1 |
| Self-financing ratio | 73.6 | 75.3 | 75.2 | 75.5 | 75.7 |
tableauTab6 – Expenditure, receipts and net borrowing of public administrations
| 2013 Q3 | 2013 Q4 | 2014 Q1 | 2014 Q2 | 2013 | |
|---|---|---|---|---|---|
| In billions of euros | |||||
| Total expenditure | 303.3 | 305.0 | 307.7 | 308.9 | 1207.7 |
| Total receipts | 281.8 | 284.1 | 286.0 | 285.1 | 1120.4 |
| Net lending (+) or borrowing (-) | -21.5 | -20.9 | -21.7 | -23.7 | -87.2 |
| In % of GDP | |||||
| Net lending (+) or borrowing (-) | -4.1 | -3.9 | -4.1 | -4.4 | -4.1 |
In Q2 2014, consumption prices stability (0.0% after +0.3% in Q1) attenuated the deceleration of households’ purchasing power, which rose by 0.5% (after +0.9%). Measured per consumption unit, households’ purchasing power increased by 0.3% (after +0.8%).
Household consumption in value rose at a rate which is close to the HDI growth (+0.4% after –0.2%). Therefore the saving ratio is also stable, at 15.9%.
Non financial corporations’ profit ratio decreased by 0.5 points at 29.3%
In Q2 2014, non financial corporations’ value added declined (–0.4% in value after +0.1%). Wages paid (including social contributions) decelerated sharply but increased again: +0.2% after +0.7%. In Q2, subsidies on production slowed after an increase in Q1 following the implementation of the CICE. As a result, non financial corporations’ margin rate droped by 0.5 points to 29.3%.
In Q2, general government deficit represented 4.4% of GDP
In Q2, general government deficit requirement was up by 0.3 points of GDP, from 4.1% to 4.4% of GDP. Receipts declined (–0.3% after +0.7% in Q1) notably because of lower receipts from corporate taxes, while expenditures slowed (+0.4% after +0.9%) as the strong Q1 increase was linked to the establishment of the CICE.
This publication includes the new estimation of the general government deficit for 2013, of 4.1% of GDP against 4.2% previously. This revision contributes to the revision of the deficit of Q1 2014 (from 4.4% to 4.1% of GDP). The quarterly general government deficit estimation is not merely accounting data but statistical data which may be revised in future publications.
Avertissement
Quarterly national accounts
Quarterly debt of the general government
Sources
Quarterly national accounts
Quarterly accounts are a consistent set of indicators which provides a global overview of recent economic activity.
Time series of the main aggregates of quarterly national accounts can be accessed through the "Summary". They are classified into eight categories:
- Gross domestic product (GDP) and main economic aggregates ;
- Goods and services ;
- Households' consumption ;
- Foreign trade ;
- Activities ;
- Institutional sectors ;
- Households' income and purchasing power ;
- Public finances.
For each category, are available :
- synthetic files displaying from the accounts the relevant information for economic analysis ,
- sometimes, one or two files displaying all the data available.
Documentation
Abbreviated methodology (pdf, 140 Ko )
Methodology - First estimate at 30 days (pdf, 112 Ko )