


 26 October 2012
2012- n° 266Demand adressed to business leaders decreased anew in Q3 2012 Quarterly business survey (goods-producing industries) - October 2012
26 October 2012
2012- n° 266Demand adressed to business leaders decreased anew in Q3 2012 Quarterly business survey (goods-producing industries) - October 2012
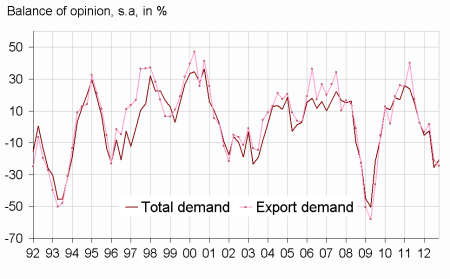
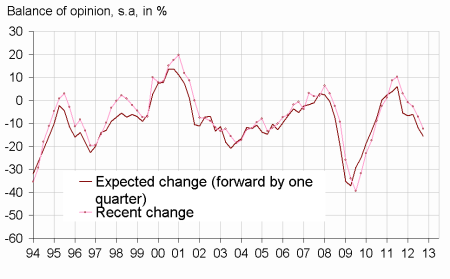
In Q3 2012, global demand adressed to business leaders remains very deteriorated and the deterioration of export demand increased. For Q4 2012, the global demand outlook improves but remains negatively oriented. The export demand outlook remains unfavourable: : the corresponding balance is steady and is below its long-term average .
Manufacturing industry
In Q3 2012, global demand adressed to business leaders remains very deteriorated and the deterioration of export demand increased. For Q4 2012, the global demand outlook improves but remains negatively oriented. The export demand outlook remains unfavourable: : the corresponding balance is steady and is below its long-term average .
Production capacity was used less in Q3 2012 than in Q2 2012: the proportion of businesses encountering production bottlenecks weakened markedly and are below its long-term average.
According to the business leaders, the industrial manpower decreased in Q3 2012 : the corresponding balance weakened and reached its long-term average. The industrial manpower could go down anew in Q4 2012.
tableautableau – Business leaders' opinion : Demand and production factors
| Manufacturing industry | MOY* | _201201 | Apr. 12 | Jul. 12 | Oct. 12 |
|---|---|---|---|---|---|
| Total demand | |||||
| Recent changes | 0 | –5 | –2 | –25 | –21 |
| Expected change | 1 | –4 | 4 | –16 | –7 |
| Export demand | |||||
| Recent changes | 3 | –3 | 2 | –21 | –25 |
| Expected change | 4 | 2 | –3 | –14 | –15 |
| Production factors | |||||
| Share of firms producing at full capacity (in%) | 22 | 27 | 28 | 26 | 19 |
| Opinion on production capacity | 15 | 19 | 22 | 25 | 26 |
| Productive capacity utilization rate (in %) | 85 | 81 | 81 | 80 | 79 |
| Difficulties of supply and demand | |||||
| Difficulties of supply and demand | 7 | 9 | 9 | 9 | 9 |
| Difficulties of supply | 20 | 15 | 14 | 12 | 15 |
| Difficulties of demand | 43 | 40 | 47 | 46 | 56 |
- * : Long period average.
- Source : Quarterly business survey - INSEE
graphiqueGraph1ang – Recent changes in demand
graphiqueGraph3ang – Workforce in manufacturing industry
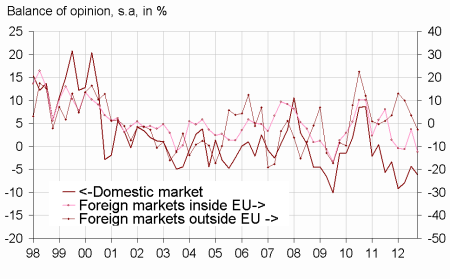
graphiqueGraph4ang – Competitive position
Documentation
Methodology (pdf,48 Ko)
Pour en savoir plus
Time series : Industry
