


 15 November 2012
2012- n° 281In October 2012, dip in imported raw materials prices Prices of oil and raw material imports - October 2012
15 November 2012
2012- n° 281In October 2012, dip in imported raw materials prices Prices of oil and raw material imports - October 2012
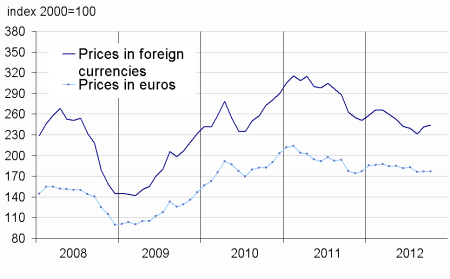
In October, the price of crude oil, in U.S. dollar terms, declined (–1.4% after +0.9% in September). It stood at $111.8 per barrel of Brent. The prices in foreign currencies of commodities except energy imported into France decreased too (–1.2% after +2.6 in September).
In October, the price of crude oil, in U.S. dollar terms, declined (–1.4% after +0.9% in September). It stood at $111.8 per barrel of Brent. The prices in foreign currencies of commodities except energy imported into France decreased too (–1.2% after +2.6 in September).
Crude oil prices setback
In October, the price of crude oil (North Sea Brent) in U.S. dollar terms per barrel fell for the first time in three months (-1.4%). It is however still more than 15$ higher than the low reached in June. In Euro terms, the decline in oil prices was slightly more marked (-2.1% after +2.8 %), due to the appreciation of the European currency against the U.S. dollar (+0.8%).
The prices of industrial raw material stabilized
In October, the prices in foreign currencies of industrial raw materials rose significantly less sharply than in September (+0.9% after +4.5%). Indeed, the prices of mineral raw materials leveled off (+0.4% after +6.9%). The prices of non–ferrous metals generally dropped (-2.1%), especially that of aluminum (-3.8%), zinc (-5.1%) and titanium (-3.4%). Copper prices (+0.0% after +7.7%) and nickel prices (+0.2% after +10.0%) stagnated. Likewise, the prices of precious metals receded (-0.4% after +11.3%), notably that of silver (-1.3%) and palladium (–3.9%).
The prices of agricultural raw materials on the opposite recovered (+2.1% after –2.1%), including that of wood pulp (+1.6 after –3.1). Natural rubber prices accelerated (+7.0% after +3.7), still sustained by export restrictions from the main South East Asian producing countries. Natural textile fibers prices deteriorated further (-1.6%), e.g. cotton prices (-2.6%).
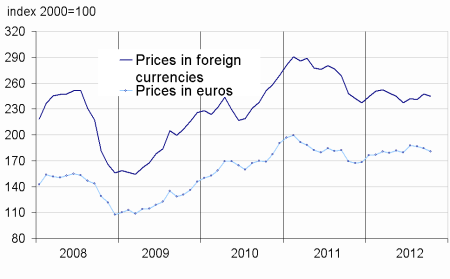
Raw food materials prices went on declining
In October, the fall of raw food materials prices, in foreign currency terms, intensified (–4.3% after –0.1% in September). In particular, oilseeds prices tumbled (-6.8%). Due to good crop prospects in South America, the prices of soybean meal (-7.8%) and soybeans (-8.1%) slumped further. In addition, the prices of palm oil registered another strong plunge (-12.7% after -5.4%), due to the accumulation of stocks in Malaysia. The world’s second largest palm oil producer also reduced tax to boost exports. Tropical foodstuff prices slipped too (-4.6%), especially cocoa prices (-7.0%), as fears about Ivory Coast production wore off, and arabica prices (-4.1%), due to abundant harvest prospects in Brazil and Colombia. Finally, cereals prices continued to head lower (-1.2% after –1.1%), that of corn in particular (-1.7%). Only sugar prices picked up (+4.7%).
tableautabpetrole_ang – Oil and petroleum products
| Prices | Change (%) | |||
|---|---|---|---|---|
| over the last month | over the last month | over the last 3 months | over the last 12 months | |
| Brent in $ per barrel | 111.8 | –1.4 | 9.3 | 3.0 |
| Brent in € per barrel | 86.2 | –2.1 | 3.5 | 9.0 |
| Supercarburant $/litre | 0.78 | –9.1 | 7.7 | 7.4 |
| Gas Oil | 984.1 | –0.2 | 10.6 | 5.8 |
| Heavy fuel | 647.4 | -7.6 | 2.1 | 0.7 |
| Naphtha | 954.9 | –1.3 | 15.8 | 8.4 |
- Prices are in dollars per tonne unless otherwise specified
- Source : INSEE
tableautabmatprem_ang – Imported raw materials (excluding energy) in foreign currencies
| Index | Changes (%) | |||
|---|---|---|---|---|
| over the last month | over the last 3 months | over the last 12 months | ||
| Food total | 273.9 | –4.3 | –0.3 | 9.6 |
| Tropical foodstuff | 230.0 | –4.6 | 1.3 | –10.5 |
| Oil seeds. vegetable oils | 355.8 | –6.8 | –1.7 | 38.0 |
| Cereals | 313.2 | –1.2 | –0.6 | 4.0 |
| Sugar | 250.3 | 4.7 | –10.4 | –22.5 |
| Beef meat | 164.3 | –1.4 | 3.5 | 6.2 |
| Industrial raw materials | 243.8 | 0.9 | 1.8 | –7.3 |
| Agricultural raw materials | 141.1 | 2.1 | –1.5 | –8.4 |
| Natural Fibers | 170.3 | –1.6 | –3.0 | –25.4 |
| Natural rubber | 364.7 | 7.0 | –1.6 | –29.7 |
| Hides | 109.0 | 1.2 | 3.4 | 9.7 |
| Wood pulp | 118.7 | 1.6 | –4.1 | –14.3 |
| Tropical wood | 144.4 | –0.6 | 1.8 | –8.0 |
| Sawn softwood | 115.8 | 0.6 | 1.3 | 26.1 |
| Minerals | 299.5 | 0.4 | 3.0 | –6.8 |
| Iron ore | 915.3 | 14.6 | –10.9 | –24.3 |
| Non-ferrous metals | 232.3 | –2.1 | 5.2 | –2.9 |
| Precious metals | 448.4 | –0.4 | 14.0 | 5.3 |
| All commodities | 244.5 | –1.2 | 1.0 | –1.5 |
- Source : INSEE
graphiqueG_petrole_ang – Oil

- Source : INSEE
graphiqueG_alim_ang – Food

- Source : INSEE
graphiqueG_ensemble_ang – All commodities
- Source : INSEE
graphiqueG_indus_ang – Industrial raw materials
- Source : INSEE
Pour en savoir plus
Time series : Raw materials prices
