


 14 February 2014
2014- n° 35Increase in business start-ups in January 2014 Enterprise births - January 2014
14 February 2014
2014- n° 35Increase in business start-ups in January 2014 Enterprise births - January 2014
In January 2014, the number of business start-ups seasonally and working-day adjusted data (sa-wda) rose compared to December: +4.1% for business setting up including self-managed enterprises, +2.4% business start-ups excluding self-managed enterprises.
Warning : From September 2013 data onwards, the seasonal and working-day adjustment model has been modified, for monthly business start-up data. Previously, only the time series for business set-ups excluding self-managed enterprises were seasonally adjusted. The self-managed enterprises time series were too short to be properly deseasonalized. From now on, the self-managed enterprises time series are seasonally adjusted for each main sector. However, for the self-managed enterprises time series in the sectors of “Financial and insurance activities”, “Real estate” and “Trade, transport, accommodation and catering” , the raw data are similar to seasonally adjusted data, due to a low number of registrations and difficulty identifying a seasonal trend.
In January 2014, the number of business start-ups seasonally and working-day adjusted data (sa-wda) rose compared to December: +4.1% for business setting up including self-managed enterprises, +2.4% business start-ups excluding self-managed enterprises.
+3.5% year-on-year (quarterly basis)
The amount of entries added up in the last quarter increased compared to the same quarter one year before (+3.5%).
The sectors that most contributed to that rise were business support activities and education, health, social work.
-1.4% year-on-year (twelve months basis)
During the last twelve months, the number of business start-ups decreased by 1.4% year-on-year.
More than one creation out of two is a self-managed enterprise
In January 2014, 51.1% businesses sets up were self-managed enterprises.
tableautab0 – business set-ups distribution by type %
| Nov. 2013 | Dec. 2013 | Jan. 2014 | |
|---|---|---|---|
| Companies | 29,5 | 29,5 | 29,4 |
| Individual enterprises | 19,3 | 19,4 | 19,5 |
| Self-managed business | 51,3 | 51,1 | 51,1 |
- Source: INSEE (Sirene)
tableautab1EN – Business set-ups by month
| Oct. 2013 | Nov. 2013 | Dec. 2013 | Jan. 2014 | |
|---|---|---|---|---|
| Excl. self-managed enterprises (sa-wda *) | 22 514 | 22 738 | 22 210 | 22 746 |
| Variation [m-o-m] % | 1.7 | 1.0 | -2.3 | 2.4 |
| Incl., self-managed enterprises | 45 325 | 45 367 | 45 713 | 47 607 |
| Variation [m-o-m] % | -1.1 | 0.1 | 0.8 | 4.1 |
- * Seasonally and working-day adjusted data
- Source: INSEE (Sirene)
tableautab2EN – business start-ups by type
| Moving total % change* | Moving total | Moving total | ||
|---|---|---|---|---|
| over 3 months | over 12 months | January- January 2014 | January- January 2013 | |
| Total | 3.5 | -1.4 | 53 070 | 50 711 |
| Companies | 3.2 | 0.1 | 15 016 | 14 706 |
| Individual enterprises | 3.7 | -2.1 | 38 054 | 36 005 |
| Of which self-managed | -0.9 | -9.6 | 27 205 | 26 088 |
- * Total of business start-ups during the last 3 or 12 months compared with the same months a year earlier
- // = meaningless
- Source: INSEE (Sirene)
graphiqueGraph1EN – Business start-ups
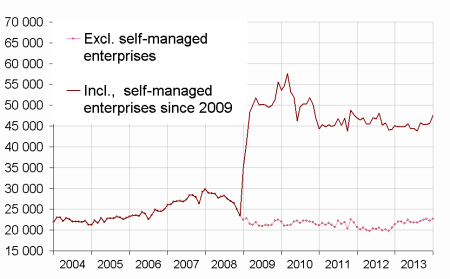
- * Seasonally and working-day adjusted data
- Source: INSEE (Sirene)
Pour en savoir plus
Time series : Business demography
