


 23 July 2013
2013- n° 172The economic climate stays unfavourable in building industry in July 2013 Monthly survey of building - July 2013
23 July 2013
2013- n° 172The economic climate stays unfavourable in building industry in July 2013 Monthly survey of building - July 2013
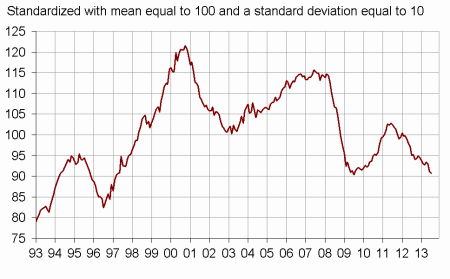
According to the business leaders surveyed in July 2013, the situation stays unfavourable in building industry: the composite indicator stays stable and below its long-term average. The turning-point indicator is in the unfavourable zone.
According to the business leaders surveyed in July 2013, the situation stays unfavourable in building industry: the composite indicator stays stable and below its long-term average. The turning-point indicator is in the unfavourable zone.
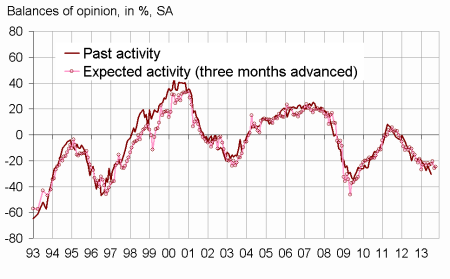
Activity remains deteriorated
The business leaders consider that their activity remains deteriorated in the recent period. The business leaders stay pessimistic about their activity in the next months.
The general business outlook, which express the business leader’s opinions about the general evolution in the sector, are very below their long term average.
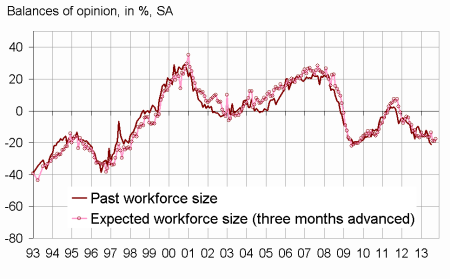
Decreasing employment
Employment in the building industry is grim: the balances of opinion corresponding to past employment and expected employment stay significantly below their long-term average.
graphiqueClimate – Composite indicator
graphiqueTurningPoint – Turning-point indicator
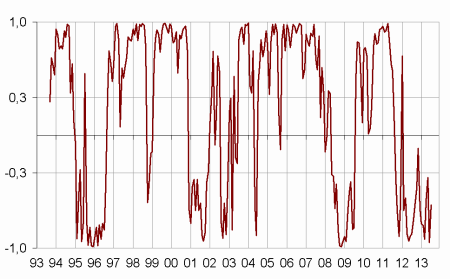
- Lecture : close to 1 (respectively -1), it indicates a favorable climate (respectively unfavorable).
tableauTableau1 – Building industry economic outlook
| Mean* | April 13 | May 13 | June 13 | July 13 | |
|---|---|---|---|---|---|
| Composite indicator | 100 | 93 | 93 | 91 | 91 |
| Past activity | –2 | –28 | –24 | –27 | –30 |
| Expected activity | –5 | –23 | –21 | –26 | –25 |
| Gen. business outlook | –17 | –50 | –47 | ||
| Past employment | –3 | –12 | –15 | –19 | –21 |
| Expected employment | –2 | –13 | –19 | –19 | –18 |
| Opinion on order books | –20 | –43 | –46 | –48 | –48 |
| Order books (in month) | 5,2 | 7,1 | 7,1 | 7,0 | 7,0 |
| Productive capacity utilisation rate | 89,0 | 85,8 | 85,9 | 86,0 | 86,2 |
| Obstacles to production increase (in %) | 34 | 19 | 21 | 21 | 22 |
| - Because of workforce shortage (in %) | 15,8 | 4,4 | 5,1 | 5,0 | 5,1 |
| Recruiting problems (in %) | 60 | 49 | 47 | ||
| Expected prices | –12 | –38 | –38 | –40 | –43 |
| Cash-flow position | –9 | –25 | –27 | ||
| Repayment period | 28 | 45 | 47 |
- * Mean since September 1993.
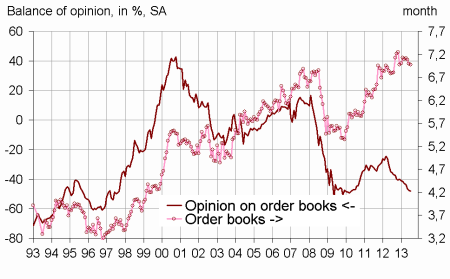
Order books are again considered significantly lower than normal
In July, business leaders are as numerous as in June to consider their order books lower than normal. The corresponding balance of opinion is in a level inferior to its long-term average.
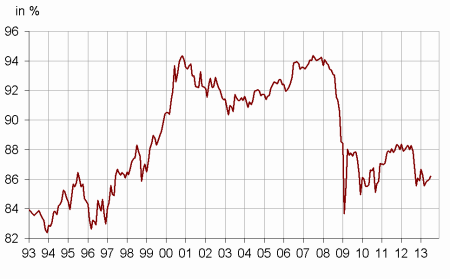
Productive capacity underused again
The productive capacity utilisation rate slightly improve but stays below its long-term average. At the same time, almost one business leader out of five declare having difficulties to increase his activity. A little less than one business leader out of two continue to feel recruiting problems; this ratio is inferior again to its long-term average.
Prices not very dynamic
In July, business leaders are more numerous than in June to indicate price downturns. The corresponding balance of opinion remains sharply inferior to its long-term average.
According to business leaders, the cash-flow position of the overall sector would deteriorate and the repayment period would get longer.
graphiquePcur – Productive capacity utilisation rate
graphiqueActivity – Activity tendency in the building industry
graphiqueWorkforce – Workforce size tendency in the building industry
graphiqueOrderBooks – Order books
Documentation
Methodology (2016) (pdf,170 Ko)
Pour en savoir plus
