


 2 April 2014
2014- n° 76In January 2014, the turnover in manufacturing industry remained stable compared
to November (0.0%) Turnover in industry and construction - January 2014
2 April 2014
2014- n° 76In January 2014, the turnover in manufacturing industry remained stable compared
to November (0.0%) Turnover in industry and construction - January 2014
In January 2014, the turnover stabilized in the manufacturing industry (0.0%) after a slight decrease in December (−0.2%). Exports rebounded (+1.7%). The turnover went down moderately in the industry as a whole (−0.5%, after +0.6% in December).

This publication is released on the 2 nd of April instead of the 31 st of March as announced because of a delay in the reception of the administrative data used to calculate the indexes.
Every index in this issue is in value, seasonally and working day adjusted. The commentary shows evolutions of subsections by decreasing contributions. The contribution of a subsection depends on the extent of the evolution and on its weight.
In January 2014, the turnover stabilized in the manufacturing industry (0.0%) after a slight decrease in December (−0.2%). Exports rebounded (+1.7%).
The turnover went down moderately in the industry as a whole (−0.5%, after +0.6% in December).
Decline over the last three months (−0.5%)
Over the quarter (q-o-q), the turnover dipped in the manufacturing industry (−0.5%) and went down very slightly in the industry as a whole (−0.2%).
It slided in other manufacturing (−0.5%) because of a substantial decline in the manufacture of basic pharmaceutical products and pharmaceutical preparations (−3.6%). It dropped in the manufacture of coke and refined petroleum products (−2.7%). It fell moderately in the electrical and electronic equipment; machine equipment (−0.5%), and in the manufacture of transport equipments (−0.2%), due to a decline in the manufacture of other transport equipments (−1.2%). It stabilized in the manufacture of food products and beverages (+0.1%).
Growth over the last year (+0.7%)
Year-on-year, the turnover rose in the manufacturing industry (+0.7%).
It surged in the manufacture of transport equipment (+4.7%) and it grew moderately in the manufacture of food products and beverages (+0.8%). Conversely, it declined in the manufacture of coke and refined petroleum products (−1.3%), and fell slightly in the electrical and electronic equipments; machine equipment (−0.4%). It levelled off in other manufacturing (0.0%).
graphiqueIRgraph3 – Turnover in manufacturing industry
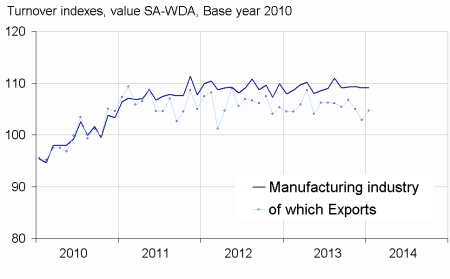
- Source: INSEE
graphiqueIRGraph4 – Turnover in manufacturing industry
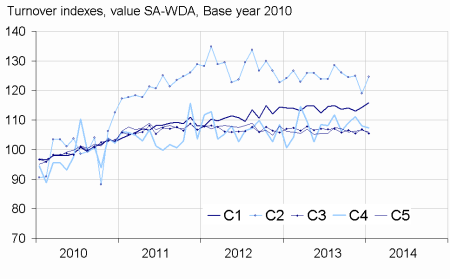
- Source: INSEE
tableauIRtab5 – Variation of the turnover in industry and construction
| NA : A 10, (A 17) | Weight** | Jan./ Dec. | Dec./ Nov. | q-o-q (1) | y-o-y (2) |
|---|---|---|---|---|---|
| BE : INDUSTRY | 10000 | –0.5 | 0.6 | –0.2 | 0.6 |
| CZ : MANUFACTURING | 8373 | 0.0 | –0.2 | –0.5 | 0.7 |
| Of which Exports | 2731 | 1.7 | –1.9 | –1.8 | –0.4 |
| (C1): Manufacture of food products and beverages | 1647 | 1.5 | 1.1 | 0.1 | 0.8 |
| (C2): Manufacture of coke and refined petroleum products | 478 | 4.7 | –4.8 | –2.7 | –1.3 |
| (C3): Electrical and electronic equipment; machine equipment | 1005 | –1.4 | 1.3 | –0.5 | –0.4 |
| (C4): Manufacture of transport equipment | 1428 | –0.6 | –2.8 | –0.2 | 4.7 |
| (C5): Other manufacturing | 3815 | –0.6 | 0.4 | –0.5 | 0.0 |
| DE: Mining and quarrying; energy; water supply; waste management | 1627 | –2.7 | 4.9 | 1.3 | –0.3 |
| FZ: CONSTRUCTION | 10000 | –3.3 | 2.5 | 0.3 | 1.0 |
- ** 10000=B...E and F
- (1) Quarter-on-quarter: last three months / three previous months
- (2) Year-on-year : last three months / three same months of previous year
- The codes correspond to different levels of aggregation of the NACE classification.
- Source: INSEE
In January 2014, the turnover went down in other manufacturing (–0.6%)
In January, the turnover declined moderately in other manufacturing (−0.6%) after a two months in a row rise. It fell mainly in the manufacture of chemicals and chemical products (−1.3%), the manufacture of basic pharmaceutical products and pharmaceutical preparations (−2.3%) and other manufacturing: repair and installation of machinery and equipment (−0.9%).
Fall in the electrical and electronic equipments (−1.4%)…
In January, the turnover decreased significantly in the electrical and electronic equipment; machine equipment (−1.4%) after a rise in December (+1.3%). It fell in the manufacture of computer, electronic and optical products (−1.9%), the manufacture of electrical equipment (−1.8%) and the manufacture of machinery and equipment n.e.c. (−1.1%).
… and in transport equipment (−0.6%)
The turnover went down in January in the manufacture of transport equipment (−0.6%, after −2.8% in December). It plunged in the manufacture of other transport equipment (−2.6%) after a sharp rise in December. Conversely, it bounced back in the manufacture of motor vehicles, trailers and semi-trailers (+1.1%).
Growth in food products and beverages (+1.5%)
The turnover in the manufacture of food products and beverages rose again in January (+1.5%, after +1.1% in December).
Rebound in coke and refined petroleum (+4.7%)
The turnover rallied in the manufacture of coke and refined petroleum products (+4.7%) after a dramatic fall in December (−4.8%).
Revisions
In the manufacturing industry, the evolution of the turnover in December was revised at −0.2%, instead of −0.5% initially published. The main correction concerned the manufacture of other transport equipment.
tableauIRtab8 – Indexes of turnover in industry and construction
| Industries : | Weight* | Jan. 2014 | Jan./ Dec. | Dec./ Nov. | q-o-q (1) |
|---|---|---|---|---|---|
| BE: INDUSTRY | 10000 | 109.5 | –0.5 | 0.6 | –0.2 |
| CZ: MANUFACTURING | 8373 | 109.1 | 0.0 | –0.2 | –0.5 |
| of which Exports | 2731 | 104.7 | 1.7 | –1.9 | –1.8 |
| (C1): Man. of food products and beverages | 1647 | 115.9 | 1.5 | 1.1 | 0.1 |
| of which Exports | 284 | 121.4 | 2.8 | 0.8 | 1.1 |
| (C2): Man. of coke and refined petroleum products | 478 | 124.6 | 4.7 | –4.8 | –2.7 |
| (C3): Electrical and electronic equipment; machine equipment | 1005 | 105.4 | –1.4 | 1.3 | –0.5 |
| of which Exports | 483 | 100.3 | –0.7 | –1.5 | –2.0 |
| [CI] Man. of computer, electronic and optical products | 269 | 100.8 | –1.9 | 3.1 | –0.4 |
| [CJ] Man. of electrical equipment | 302 | 100.0 | –1.8 | 0.1 | –1.1 |
| [CK] Man. of machinery and equipment n.e.c. | 434 | 111.9 | –1.1 | 1.3 | –0.2 |
| (C4): Man. of transport equipment | 1428 | 107.4 | –0.6 | –2.8 | –0.2 |
| of which Exports | 693 | 95.6 | 1.3 | –2.0 | –6.0 |
| [CL1] Man. of motor vehicles, trailers and semi-trailers | 689 | 91.9 | –2.6 | 2.3 | 1.5 |
| [CL2] Man. of other transport equipment | 739 | 121.9 | 1.1 | –6.3 | –1.2 |
| (C5): Other manufacturing | 3815 | 106.0 | –0.6 | 0.4 | –0.5 |
| of which Exports | 1213 | 106.6 | 1.8 | –1.9 | 0.2 |
| [CB] Man. of textiles, wearing apparel, leather and related products | 191 | 109.0 | –0.5 | 0.2 | 0.4 |
| [CC] Man. of wood and paper products; printing and reproduction of recorded media | 427 | 101.7 | 0.1 | 0.3 | –1.3 |
| [CE] Man. of chemicals and chemical products | 706 | 106.7 | –1.3 | –0.2 | –1.1 |
| [CF] Man. of basic pharmaceutical products and pharmaceutical preparations | 322 | 96.9 | –2.3 | –0.7 | –3.6 |
| [CG] Man. of rubber and plastics products, and other non-metallic mineral products | 620 | 105.9 | 0.2 | 1.5 | –0.6 |
| [CH] Man. of basic metals and fabricated metal products, except machinery and equipment | 900 | 106.3 | –0.3 | 0.4 | –0.4 |
| [CM] Other manufacturing; repair and installation of machinery and equipment | 649 | 111.1 | –0.9 | 0.8 | 1.5 |
| DE: Mining and quarrying; energy, water supply, sewerage, waste management | 1627 | 111.3 | –2.7 | 4.9 | 1.3 |
| [BZ] Mining and quarrying | 69 | 110.9 | 0.2 | 5.5 | –2.1 |
| [DZ] Electricity, gas, steam and air-conditioning supply | 1216 | 113.1 | –2.9 | 5.8 | 1.8 |
| [EZ] Water supply; sewerage, waste management and remediation | 342 | 105.1 | –2.4 | 1.0 | 0.7 |
| FZ: CONSTRUCTION | 10000 | 104.7 | –3.3 | 2.5 | 0.3 |
- ** 10000=B...E and F
- (1) Quarter-on-quarter: last three months / three previous months
- Source: INSEE
tableauIRtab7 – Measure of variations' revisions
| Dec./ Nov. | Nov./ Oct. | Oct./ Sept. | Q4 2013/ Q3 2013 | 2013/ 2012 | |
|---|---|---|---|---|---|
| Industry (BE) | 0.82 | 0.00 | 0.00 | 0.33 | 0.11 |
| raw serie | 1.19 | 0.00 | 0.00 | 0.42 | 0.10 |
| SA-WDA coeff. | –0.36 | 0.00 | 0.00 | –0.08 | 0.01 |
| Manufacturing industry (CZ) | 0.37 | 0.00 | –0.09 | 0.06 | 0.06 |
| raw serie | 0.63 | 0.00 | 0.00 | 0.22 | 0.05 |
| SA-WDA coeff. | –0.27 | 0.00 | –0.09 | –0.16 | 0.01 |
- Foot note: in the industry, the SA-WDA evolution between November and December 2013 is revised by +0.82 point: +1.19 point is due to the raw serie's revision and −0.36 to the new calculation of the SA-WDA.
- Source: INSEE
Documentation
Methodology (pdf,140 Ko)
Pour en savoir plus
Time series : Turnover indices (VAT)
