


 12 July 2013
2013- n° 166In June 2013, further decline in prices of imported raw materials Prices of oil and raw material imports - June 2013
12 July 2013
2013- n° 166In June 2013, further decline in prices of imported raw materials Prices of oil and raw material imports - June 2013
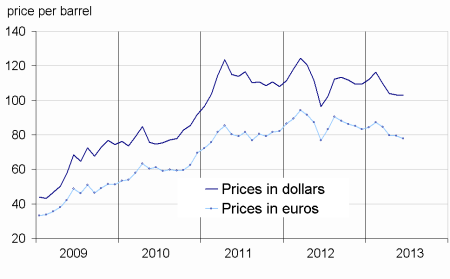
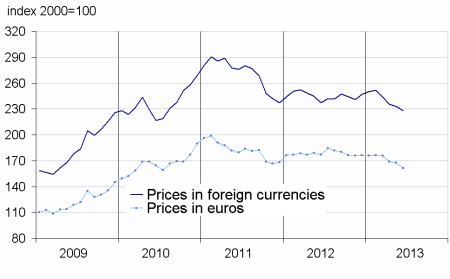
In June, the crude oil price in euro terms fell again (-1.8%), reaching € 77.9 per barrel of Brent. Prices in euros terms of commodities except energy imported into France also decreased significantly (-3.7%), essentially due to the decline of the prices of industrial raw materials (-4.9%), while prices of raw food materials were slightly down (-1.9%).
In June, the crude oil price in euro terms fell again (-1.8%), reaching € 77.9 per barrel of Brent. Prices in euros terms of commodities except energy imported into France also decreased significantly (-3.7%), essentially due to the decline of the prices of industrial raw materials (-4.9%), while prices of raw food materials were slightly down (-1.9%).
Decline in oil prices in euros terms
In June, the price of crude oil from the North Sea (Brent) in dollars terms remained stable (-0.2% after –0.4% in May), in a context of weaker demand of oil. It stood at $102.8 per barrel. However, in euros terms, the decrease is a bit more pronounced (-1.8% after –0.4% in May), due to an appreciation of the euro (+1.6% against the dollar).
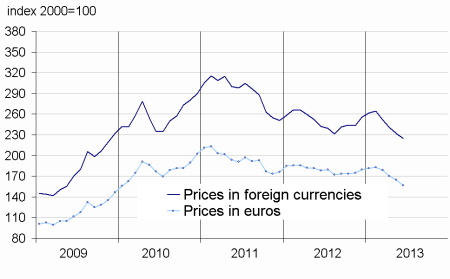
Further decline in prices of imported industrial raw material
In June, prices of industrial raw materials in euros terms declined again (-4.9% after -3.2% in May). Prices of mineral raw materials decreased sharply again (-4.8% after –3.1%). In particular, prices of non-ferrous metals and iron ores fellagain respectively (-3.5% after –1.0%) and (-8.9% after 9.4%), due to a low demand from China (world’s largest consumer of metals). This is particularly the case of the prices of aluminum (–2.4%), copper (–4.7%) and nickel (–6.1%). Prices of precious metals further declined significantly again (–6.9% after –4.4%), especially those of silver (–9.7%) and gold (-6.5%).
Moreover, prices of agro-industrial raw materials continued to drop sharply in June (-5.1% after –3.8% in May). In particular, prices of sawn softwood (-10.4%) dropped, as well as natural rubber (-9.3%). Prices of natural textile fibers fell (-1.3%) after a slight rise in May (+0.2%), mainly due to a decline in cotton prices (-1.2%).
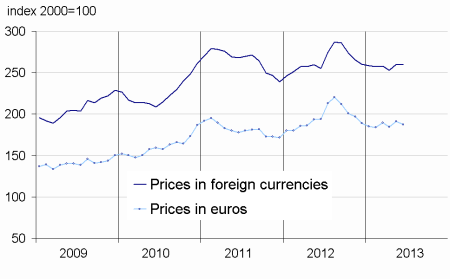
Lower prices of raw food materials
In June, prices of raw food materials in euros terms retreated (-1.9%) after a sharp increase in May (+3.4%). Prices of tropical foodstuff (-6.5% after +1.2%) dropped, due to the high declines in the prices of arabica (-10.3%) and robusta (-9.7%), because of improved production prospects in Brazil and Vietnam.
Prices of cocoa (-3.8%) also declined. In addition, prices of cereals (-2.8%), also dropped, driven down by the fall in corn prices (-3.0%) due to improved prospects of harvest in the United States and South America. Prices of beef meat, as well as sugar (-4.4%) also bended. In contrast, prices of oilseeds (+2.6% after +5.8%) continued to rise, largely due to higher prices of soybean meal (+5.0%) and soybean (+1.4%). Indeed, fears are appeared on the quality of the crop in the United States.
tableautabpetrole – Oil and petroleum products
| Prices | Change (%) | |||
|---|---|---|---|---|
| over the last month | over the last month | over the last 3 months | over the last 12 months | |
| Brent in $ per barrel | 102.8 | –0.2 | –6.2 | 6.6 |
| Brent in € per barrel | 77.9 | –1.8 | –7.9 | 1.4 |
| Gasoline €/L | 0.55 | –1.6 | –7.1 | –0.5 |
| Gas Oil | 661.9 | –0.1 | –6.2 | –1.6 |
| Heavy fuel | 460.1 | –0.6 | –4.0 | –3.3 |
| Naphtha | 640.4 | 0.2 | –8.7 | 9.7 |
- Prices are in euros per tonne unless otherwise specified
- Source : INSEE
tableautabmatprem – Imported raw materials (excluding energy) in euros
| Index | Changes (%) | |||
|---|---|---|---|---|
| over the last month | over the last 3 months | over the last 12 months | ||
| Food total | 187.4 | –1.9 | –1.2 | –3.4 |
| Tropical foodstuff | 139.0 | –6.5 | –4.4 | –12.8 |
| Oil seeds. vegetable oils | 254.6 | 2.6 | 5.0 | 6.4 |
| Cereals | 201.2 | –2.8 | –7.0 | –8.6 |
| Sugar | 140.8 | –4.4 | –11.0 | –22.9 |
| Beef meat | 118.7 | –4.7 | –5.5 | –3.3 |
| Industrial raw materials | 156.8 | –4.9 | –12.3 | –11.9 |
| Agricultural raw materials | 100.9 | –5.1 | –12.2 | –7.7 |
| Natural Fibers | 132.5 | –1.3 | –4.3 | 5.0 |
| Natural rubber | 248.7 | –9.3 | –19.0 | –23.5 |
| Hides | 86.1 | –2.3 | 2.2 | 11.5 |
| Wood pulp | 88.3 | –0.9 | 1.1 | –3.6 |
| Tropical wood | 97.9 | –0.3 | 0.9 | –7.0 |
| Sawn softwood | 81.4 | –10.4 | –27.5 | –5.8 |
| Minerals | 187.4 | –4.8 | –12.4 | –13.1 |
| Iron ore | 644.4 | –8.9 | –19.4 | –18.9 |
| Non-ferrous metals | 144.5 | –3.5 | –9.6 | –10.8 |
| Precious metals | 237.3 | –6.9 | –18.9 | –18.8 |
| All commodities | 161.3 | –3.7 | –8.2 | –8.7 |
- Source : INSEE
graphiqueG_petrole_ang – Oil
- Source : INSEE
graphiqueG_alim_ang – Food
- Source : INSEE
graphiqueG_ensemble_ang – All commodities
- Source : INSEE
graphiqueG_indus_ang – Industrial raw materials
- Source : NSEE
Pour en savoir plus
Time series : Raw materials prices
