


 23 October 2013
2013- n° 241Demand adressed to business leaders improves again in the third quarter 2013 Quarterly business survey (goods-producing industries) - October 2013
23 October 2013
2013- n° 241Demand adressed to business leaders improves again in the third quarter 2013 Quarterly business survey (goods-producing industries) - October 2013
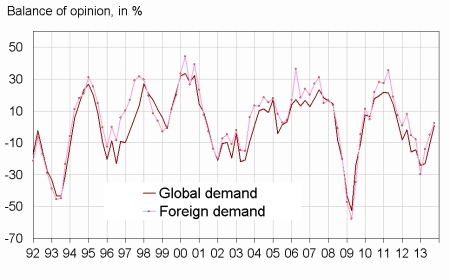
In the third quarter, the improvement of global and foreign demand has gone on : the corresponding balances reach now their long-term average. The anticipations of industrialists about the expected change in global and foreign demand in the fourth quarter 2013 get better clearly.
Demand
Improvement of global and foreign demand
In the third quarter, the improvement of global and foreign demand has gone on : the corresponding balances reach now their long-term average. The anticipations of industrialists about the expected change in global and foreign demand in the fourth quarter 2013 get better clearly.
graphiqueGraphang1 – Past change in demand
Production factors
The tensions on the means of production go up slightly
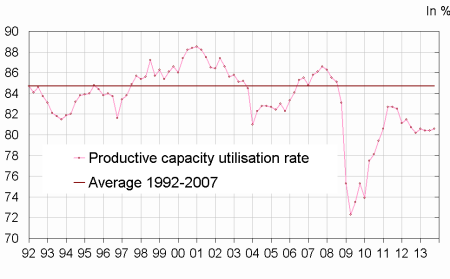
Over the third quarter 2013, the tensions of the means of production go up slightly but they remain weak. So the productive capacity utilisation rate increases by one point compared with the previous quarter but remains below its average level, indicating that the means of production are underused in the manufacturing industry. The balance on production bottlenecks increase slightly and is now above its long-term average.
graphiqueGraphang2 – Change in the productive capacity utilisation rate
tableautableau1 – Industrialists' opinion : demand and production factors
| Manufacturing industry | Aver.* | Jan. 13 | Avril 13 | Juil. 13 | Oct. 13 |
|---|---|---|---|---|---|
| Global demand | |||||
| Past change | 0 | –24 | –23 | –11 | 1 |
| Future change | 1 | –9 | –4 | –6 | 1 |
| Foreign demand | |||||
| Past change | 3 | –30 | –14 | –5 | 2 |
| Future change | 4 | –14 | 2 | –2 | 10 |
| Production factors | |||||
| Production bottlenecks (in %) | 22 | 27 | 25 | 23 | 25 |
| Assessment of productive capacity | 14 | 23 | 23 | 14 | 13 |
| Productive capacity utilisation rate (in %) | 85 | 81 | 80 | 80 | 81 |
| Difficulties of supply and demand | |||||
| Difficulties of supply and demand | 8 | 8 | 12 | 12 | 11 |
| Difficulties of supply | 20 | 19 | 18 | 14 | 14 |
| Difficulties of demand | 44 | 57 | 47 | 50 | 47 |
- * : Long-term average.
- Source : Quaterly business survey - Insee
Workforce
Improvement of balances of the worforce size
According to the business managers, the rate of job shedding in the industry stabilizes over the last months. Over the next months, industrialists are more optimistic about the change in workforce size.
The percentage of companies experiencing hiring difficulties in the manufacturing industry is slightly stable and reaches its long-term average.
graphiqueGraphang3 – Workforce size in the manufacturing industry
Wages and working time
According to the business managers in the manufacturing industry, the wages increase by 0,2 % over the third quarter 2013.
The industrialists are less numerous in October to indicate a fall in the weekly working time both in the last and in the next months.
Cash-flow and selling prices
In the third quarter 2013, the proportion of industrialists experiencing cash-flow problems is slightly steady compared with the previous quarter and reaches its average level.
According to the business managers, the selling prices in the manufacturing industry go up slightly in the third quarter 2013. They forecast a fall in selling prices for the next quarter.
Competitive position
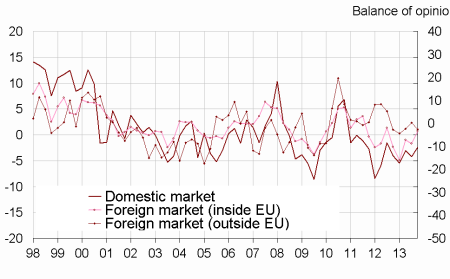
According to the industrialists, in the third quarter 2013, their competitive position remains deteriorated on domestic market and foreign markets inside EU, even if it recovers slightly. It gets worst once again on foreign market outside EU.
The general exportation expectations rebund markedly. For the first time since the second quarter 2011, the corresponding balance is now above its long-term average.
graphiqueGraphang4 – Competitive position
tableautableau2 – Industrialists'opinion : employment, competitive position, cash-flow, wages and selling prices
| Manufacturing industry | Aver.* | Jan. 13 | Avril 13 | Juil. 13 | Oct. 13 |
|---|---|---|---|---|---|
| Workforce size | |||||
| Past change | –11 | –11 | –12 | –12 | –11 |
| Expected change | –13 | –13 | –14 | –13 | –7 |
| Difficulties hiring | 28 | 24 | 27 | 27 | 28 |
| Working time | |||||
| Past change | –3 | –6 | –5 | –1 | 1 |
| Expected change | –5 | –9 | –7 | –2 | –1 |
| Cash-flow and wages | |||||
| Cash-flow problems | 15 | 16 | 14 | 15 | 14 |
| Past wages | 0,5 | 0,4 | 0,4 | 0,4 | 0,2 |
| Selling prices | |||||
| Past change | 0,2 | –0,1 | 0,4 | –0,6 | 0,2 |
| Expected change | 0,2 | 0,3 | 0,0 | 0,0 | –0,2 |
| Competitive position | |||||
| On domestic market | 1 | –5 | –3 | –4 | –2 |
| On foreign markets inside EU | 0 | –16 | –7 | –9 | –3 |
| On foreign markets outside EU | –1 | –4 | –2 | 0 | –3 |
| General exportation expectations | –10 | –34 | –43 | –31 | –4 |
- * : Long-term average.
- Source : Quaterly business survey - Insee
Documentation
Methodology (pdf,48 Ko)
Pour en savoir plus
Time series : Industry
