


 16 September 2013
2013- n° 212Slight rise in services producer prices Services producer price indices - 2nd Quarter 2013
16 September 2013
2013- n° 212Slight rise in services producer prices Services producer price indices - 2nd Quarter 2013
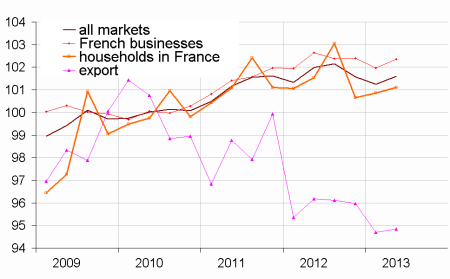
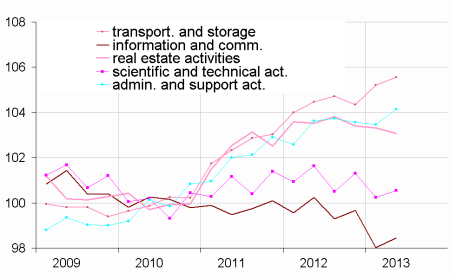
In the second quarter of 2013, services producer prices sold to French businesses improved slightly (+0.4 % following –0.4 % in the last quarter), reaching the same level as at the end of 2012. All the different types of services were on the rise this quarter, except for real estate activities whose prices were stable (–0.2 %).
- SPPI, production sold to French businesses
- Rise in prices for administrative and support activities (+0.7 %) and for information and communication services (+0.4 %)…
- … and more modest rise in prices for transport services (+0.3 %) and scientific and technical activities (+0.3 %)
- SPPI, production sold to households in France
- SPPI, production sold on foreign markets
- SPPI (all markets)
SPPI, production sold to French businesses
In the second quarter of 2013, services producer prices sold to French businesses improved slightly (+0.4 % following –0.4 % in the last quarter), reaching the same level as at the end of 2012. All the different types of services were on the rise this quarter, except for real estate activities whose prices were stable (–0.2 %).
Rise in prices for administrative and support activities (+0.7 %) and for information and communication services (+0.4 %)…
After three quarters of almost no change, prices for administrative and support activities advanced (+0.7 % following –0.1 %). In particular, prices for employment activities increased (+0.7 % following 0.0 %), most notably for employment placement agencies (+1.1 %) and temporary employment agencies (+0.8 %). On the other hand, prices for rental services of motor vehicles moved down (–0.9 % following –0.1 %).
Prices for information and communication services picked up (+0.4 %, following –1.6 %), most notably prices for computer services (+0.6 % following –0.5 %).
… and more modest rise in prices for transport services (+0.3 %) and scientific and technical activities (+0.3 %)
Prices for water transport services (+4.3 % following –0.8 %) and air transport services (+3.3 % following –3.2 %) moved up, while prices for freight transport services by road were stable (–0.2 % following +0.7 %).
Prices for scientific and technical activities increased (+0.3 % following –1.1 %), most notably advertising (+0.5 % following –3.9 %) and engineering services (+0.3 % following –1.6 %).
SPPI, production sold to households in France
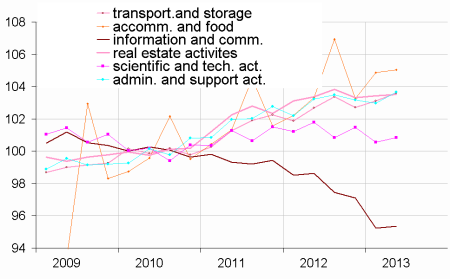
Services producer price sold to households in France were almost unchanged in the second quarter of 2013 (+0.2 % following +0.2 %). Prices for information and communication services continued to drop (–1.1 % following –2.8 %), while prices for administrative and support activities recovered (+1.6 % following –1.1 %).
SPPI, production sold on foreign markets
Services producer prices sold on foreign markets were stable in the second quarter of 2013 (+0.2 %, following –1.3 %), but declined year-over-year (–1.4 %).
SPPI (all markets)
On all markets, services producer prices rose slightly (+0.3 % following –0.3 %). Year-over-year, they dipped moderately (–0.4 %).
graphiqueGraphique1 – Producer price indices for all services
graphiqueGraphique2 – Producer price indices of services sold to French businesses
graphiqueGraphique3 – Services producer price indices, all markets
tableauTableau 1 – Services producer price indices, by sectors:
| Sections and choices of | Weight | Indices | Change in % | |
|---|---|---|---|---|
| levels in NAF rev.2 | 2013Q2 | Q/Q–1 | Q/Q–4 | |
| Prices of services sold to French businesses (BtoB) | ||||
| HN : all services | 1000 | 102.4 | 0.4 | -0.3 |
| H : transport. and storage | 187 | 105.5 | 0.3 | 1.0 |
| 49.41 : freight trans. by road | 65 | 105.5 | -0.2 | 0.6 |
| J : information and comm. | 222 | 98.5 | 0.4 | -1.8 |
| 62 : IT services | 87 | 101.6 | 0.6 | 0.6 |
| L : real estate activities | 100 | 103.1 | -0.2 | -0.4 |
| M : prof., scient. and tech. | 200 | 100.6 | 0.3 | -1.1 |
| 69 : legal and accounting | 38 | 102.4 | -0.4 | -0.4 |
| 70.2 : management consult. | 43 | 102.4 | 1.1 | 0.8 |
| 71.12 : engineering | 64 | 100.0 | 0.3 | -1.5 |
| 73.1 : advertising | 26 | 97.3 | 0.5 | -3.0 |
| N : administ. and support | 260 | 104.1 | 0.7 | 0.5 |
| 77.1 : renting of motor veh. | 17 | 102.6 | -0.9 | -1.0 |
| 77.3 : renting of mach. | 30 | 102.5 | 0.5 | -0.4 |
| 78 : employment activities | 50 | 106.2 | 0.7 | 0.6 |
| 81 : services to buildings and landscape activities | 28 | 104.7 | 0.1 | 2.0 |
| S95 : repair of computers and person. and household goods | 9 | 108.6 | 0.8 | 1.2 |
| Prices of services sold to households in France (BtoC) | ||||
| HN : all services | 1000 | 101.1 | 0.2 | -0.4 |
| H : transport. and storage | 168 | 104.5 | 1.2 | 1.8 |
| I : accommodation and food | 337 | 105.1 | 0.1 | 1.7 |
| J : information and comm. | 186 | 86.4 | -1.1 | -12.4 |
| L : real estate activities | 177 | 104.2 | 0.6 | 0.8 |
| M : prof., scient. and tech. | 71 | 103.4 | -0.1 | 1.6 |
| N : administ. and support | 43 | 100.2 | 1.6 | -2.9 |
| S95 : repair of computers and person. and household goods | 18 | 108.2 | 0.6 | 1.1 |
| Export prices of services (BtoE) | ||||
| HN : all services | 1000 | 94.8 | 0.2 | -1.4 |
| H : transport. and storage | 473 | 92.7 | 0.1 | -0.5 |
| 49.41 : freight transp. by road | 64 | 106.0 | -0.6 | -0.1 |
| 50.20 : sea and coast. freight | 142 | 57.5 | -7.6 | -6.5 |
| 50.40 : inland freight water | 1 | 112.6 | -1.2 | -1.5 |
| 51.21 : freight air transport | 21 | 128.4 | 0.7 | 5.6 |
| 53 : postal and courier serv. | 13 | 110.6 | 0.0 | 3.0 |
| JB : telecommunications | 51 | 63.1 | -0.5 | -17.4 |
| 70.22 : busin. & mgt consult. | 46 | 99.7 | 1.7 | -1.8 |
| 71.12 : engin. & tech. consult. | 66 | 101.9 | 0.1 | 0.2 |
| Prices of services sold on all markets (BtoAll) | ||||
| HN : all services | 1000 | 101.6 | 0.3 | -0.4 |
| H : transport. and storage | 200 | 103.6 | 0.5 | 0.9 |
| I : accommodation and food | 98 | 105.0 | 0.2 | 1.7 |
| J : information and comm. | 208 | 95.3 | 0.1 | -3.3 |
| L : real estate activities | 113 | 103.5 | 0.1 | 0.1 |
| M : prof., scient. and tech. | 167 | 100.8 | 0.3 | -0.9 |
| N : administ. and support | 204 | 103.7 | 0.7 | 0.4 |
| S95 : repair of computers and person. and household goods | 11 | 108.4 | 0.7 | 1.3 |
- Source : INSEE
tableauTableau 2 – Measure of revision for each indicator at the HN 'all services' level
| Services producer price indices | 2013Q1 / 2012Q4 |
|---|---|
| - services sold to all markets | -0.2 |
| - services sold to French businesses | -0.2 (1) |
| - services sold to consumers in France | // |
| - export of services | -0.3 |
- (1) Reading note : the change in indice between 2012Q4 and 2013Q1 published at the end of May was -0.2 %. It has been revised at -0.4 % ; that is to say a revision of -0.2 %.
Documentation
Simplified methodology (pdf,134 Ko)
Pour en savoir plus
Time series : Services producer price indices
