


 11 September 2013
2013- n° 206Ongoing decrease in payroll employment in Q2 2013 Payroll employment - 2nd Quarter 2013
11 September 2013
2013- n° 206Ongoing decrease in payroll employment in Q2 2013 Payroll employment - 2nd Quarter 2013
In Q2 2013, payroll employment in principally market sectors decreased by 0.2% q-o-q (- 34,600 jobs), after 0.0% (-4,700) in the previous quarter. Excluding temporary work, employment felt back in Q2 2013 (-30,300 jobs).
In Q2 2013, payroll employment in principally market sectors decreased by 0.2% q-o-q (- 34,600 jobs), after 0.0% (-4,700) in the previous quarter. Excluding temporary work, employment felt back in Q2 2013 (-30,300 jobs).
Recover in temporary employment
Temporary employment decreased this quarter : -0.8% (-4,300 jobs), after +2.0 % in Q1 2013 (+10,300 jobs).
tableautableau_1 – Payroll employment change in the competitive sector : thousands …
| Change in 3 months | Change in 1 year | Level | ||
|---|---|---|---|---|
| 2013 | 2013 | 2013 | 2013 | |
| Q1 | Q2 | Q2 | Q2 | |
| Principally market sectors | –4,7 | –34,6 | –139,1 | 15928,7 |
| Goods-producing industries excl. Construction | –11,7 | –19,0 | –49,6 | 3211,7 |
| Manufacturing | –12,0 | –19,1 | –50,5 | 2839,8 |
| Construction | –8,9 | –7,7 | –29,8 | 1400,6 |
| Services | 15,9 | –7,8 | –59,8 | 11316,4 |
| of which : Temporary employment | 10,3 | –4,3 | –27,3 | 517,3 |
| Principally non-market sectors (*) | –0,6 | 4,6 | 12,4 | 1959,7 |
| Total competitive sector (*) | –5,4 | –30,0 | –126,7 | 17888,4 |
tableautableau_2 – ... Percentage
| Change in 3 months | Change in 1 year | ||
|---|---|---|---|
| 2013 | 2013 | 2013 | |
| Q1 | Q2 | Q2 | |
| Principally market sectors | 0,0 | –0,2 | –0,9 |
| Goods-producing industries excl. Construction | –0,4 | –0,6 | –1,5 |
| Manufacturing | –0,4 | –0,7 | –1,7 |
| Construction | –0,6 | –0,5 | –2,1 |
| Services | 0,1 | –0,1 | –0,5 |
| of which : Temporary employment | 2,0 | –0,8 | –5,0 |
| Principally non-market sectors (*) | 0,0 | 0,2 | 0,6 |
| Total competitive sector (*) | 0,0 | –0,2 | –0,7 |
- (*) Excl. Agriculture and public employees in non-markets sectors (administration, health, education and social activity) ; na : not available
- Source : INSEE
tableautableau_4 – Payroll employment change in the competitive sector (*)
| Code | Change in 3 months | Change in 1 year | Level | ||
|---|---|---|---|---|---|
| Naf | 2013 | 2013 | 2013 | 2013 | |
| rev.2 | Q1 | Q2 | Q2 | Q2 | |
| DE | Electricity, gas, steam, and air conditioning supply ; water supply, sewerage, waste management and remediation activities | 0,3 | 0,1 | 0,9 | 371,9 |
| C1 | Manufacture of food products beverage and tobacco products | –0,7 | –4,4 | –7,2 | 542,8 |
| C2 | Manufacture of coke, and refined petroleum products | 0,0 | –0,4 | –0,6 | 9,7 |
| C3 | Manufacture of computer, electronic and electrical products; manufacture of machinery and equipment | –2,1 | –2,0 | –7,3 | 442,4 |
| C4 | Manufacture of transport equipment | –1,5 | –2,1 | –4,1 | 365,4 |
| C5 | Other manufacturing | –7,7 | –10,3 | –31,3 | 1479,4 |
| FZ | Construction | –8,9 | –7,7 | –29,8 | 1400,6 |
| GZ | Wholesale and retail trade ; repair of motor vehicles and motorcycles | –6,3 | –10,7 | –30,3 | 3000,9 |
| HZ | Transportation and storage | 0,7 | –1,4 | –3,4 | 1344,8 |
| IZ | Accommodation and food service activities | 1,1 | –0,9 | –5,5 | 973,0 |
| JZ | Information and communication | 0,6 | –5,4 | –5,6 | 701,5 |
| KZ | Financial and insurance activities | –1,7 | –1,0 | –0,2 | 843,4 |
| LZ | Real estate activities | –0,2 | 0,1 | –2,0 | 233,2 |
| MN | Professional, scientific and technical activities; administrative and support service activities | 17,1 | 0,0 | –15,1 | 2914,2 |
| of which : Temporary employment | 10,3 | –4,3 | –27,3 | 517,3 | |
| OQ | Public administration and defence ; compulsory social security; education; human health and social work activities | –0,6 | 4,6 | 12,4 | 1959,7 |
| RU | Other service activities | 4,7 | 11,6 | 2,3 | 1305,4 |
- (*) Excl. Agriculture and public employees in non-markets sectors (administration, health, education and social activity)
- Source : INSEE
graphiqueGraph1 – Payroll employment in principally market sectors
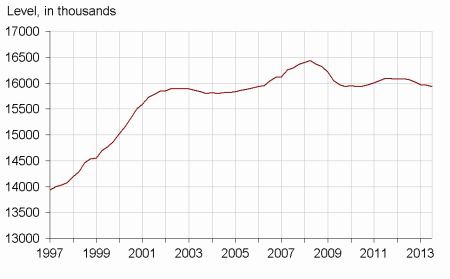
- Source : INSEE
Documentation
Methodology (pdf,135 Ko)
Pour en savoir plus
