


 30 August 2013
2013- n° 201In June 2013, the sales volume decreased in the retail trade, except for motor vehicles
and motorcycles, and in personal services Sales volume in the retail trade and personal services - june 2013
30 August 2013
2013- n° 201In June 2013, the sales volume decreased in the retail trade, except for motor vehicles
and motorcycles, and in personal services Sales volume in the retail trade and personal services - june 2013
In June 2013, the sales volume declined compared to May in the retail trade, except for motor vehicles and motorcycles (–1.4%), in household services (–1.2%) and in accommodation and food service activities (–0.7%). It was broadly stable in the trade and repair of motor vehicles and motorcycles (+0.1%).
In June 2013, the sales volume declined compared to May in the retail trade, except for motor vehicles and motorcycles (–1.4%), in household services (–1.2%) and in accommodation and food service activities (–0.7%). It was broadly stable in the trade and repair of motor vehicles and motorcycles (+0.1%).
Over the second quarter 2013 (q-o-q), the sales volume went up slightly in the retail trade, except for motor vehicles and motorcycles (+0.6%), in accommodation and food service activities (+0.5%), in household services (+0.5%) and in the trade and repair of motor vehicles and motorcycles (+0.4%).
Over the year (y-o-y), the sales volume fell significantly in the trade and repair of motor vehicles and motorcycles (–3.7%) and in accommodation and food services activities (–1.8%). It rose in the retail trade, except for motor vehicles and motorcycles (+0.9%) and remained stable in household services (0.0%).
graphiqueGraph1_Anglais – Volume of sales in the retail trade and personal services
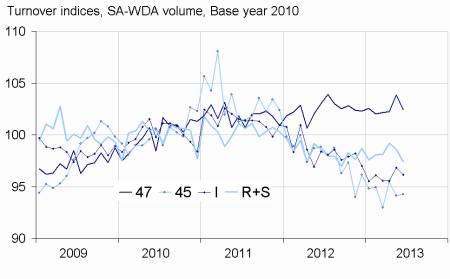
- Source : INSEE
In July 2013, the sales volume in the retail trade is expected to rise (+1.9%).
Revisions
The evolution in May has been revised by +0.2 point in household services, by –0.2 point in accommodation and food service activities and by +0.1 point in the trade and repair of motor vehicles and motorcycles. In the same period, the volume of sales’ variation has been confirmed in the retail trade, except for motor vehicles and motorcycles.
tableauTab1_anglais – Variation of sales volume in the retail trade and personal services
| Change in % | |||||
|---|---|---|---|---|---|
| NACE Classification | Weight | June/ May | May/ April | q-o-q (1) | y-o-y (2) |
| 47 Retail trade, except for motor vehicles and motorcycles | 1000 | –1.4 | 1.6 | 0.6 | 0.9 |
| 471 Retail sale in non-specialized stores | 369 | –1.8 | 1.8 | 0.3 | –0.3 |
| 472 to 477 Retail sale in specialized stores | 573 | –1.4 | 1.6 | 0.9 | 1.9 |
| 478 and 479 Retail trade not in stores | 58 | 0.2 | –0.1 | –0.2 | –0.8 |
| 45 Trade and repair of motor vehicles and motorcycles | 1000 | 0.1 | –1.4 | 0.4 | –3.7 |
| I Accommodation and food service activities | 1000 | –0.7 | 1.3 | 0.5 | –1.8 |
| R+S Household services | 1000 | –1.2 | –0.6 | 0.5 | 0.0 |
| R Arts, entertainment and recreation | 449 | –1.5 | –1.3 | 1.0 | –0.8 |
| S Other service activities | 551 | –1.0 | 0.0 | 0.1 | 0.7 |
- (1) Quarter-on-quarter: last three months / three previous months.
- (2) Year-on-year: last three months / three same months of the previous year.
- Source: INSEE
tableauTabprecoce_anglais – Variation of sales volume in the retail trade : early estimate*
| Change in % | ||
|---|---|---|
| July 2013/ June 2013 | July 2013/ July 2012 | |
| 47 Retail trade, except for motor vehicles and motorcycles | 1.9 | 0.5 |
- * Econometric estimate from a set of sources available within 30 days after the end of the reference month
- Source: INSEE
Documentation
Methodology (pdf,121 Ko)
Pour en savoir plus
